The volatility from last week’s actions by the SNB has led to making a mess of the daily and hourly charts. This takes away some of the technical vision from the perspective of those time periods. All is not lost, however. The 5 minute chart can be helpful in defining risk levels – and can keep trading more contained (and risk low in the process) – if it can be shown that traders are using the levels to define and limit risk. That is what I look for, at least.
So how can traders use the chart and what is it telling traders now?

EURCHF on the 5 minute
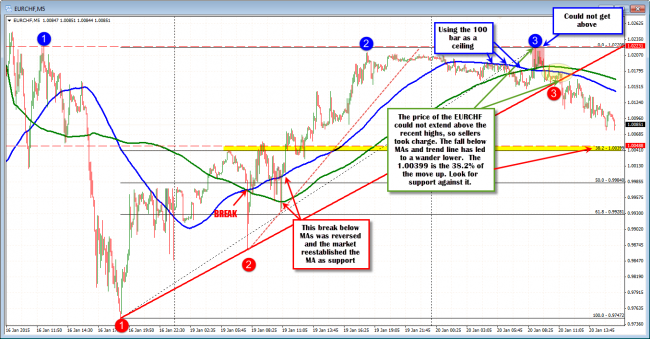
Looking at the 5 minute chart above, the first thing I notice is the action shows that some of the spikes are becoming less volatile. This is suggesting a more normalcy in the pair. Is it out of the woods? No but let’s say, the market is less risky now. Traders can use technical levels to define and limit risk and there are some patterns from the technicals which suggest traders are paying attention and not just “winging it around” in a low liquidity environment. That is reassuring.
Let’s take a look back first to see what “the market” is responding to.
Yesterday – largely in the Asian session – there were a few spiky moves. The first one, saw a sharp move on the break of the 100 and 200 bar MA (blue and green line) and equally quick rebound (buyers?). The second break lower yesterday, saw a move below the 200 bar MA briefly, but then a rally up and reestablishment of the 100 bar MA as support (buyers again?). The action after those two breaks was less volatile but bullish as the price extended up to the last high from Friday’s trade. Activity slowed into the Asian session today.
In trading today, the price could not get above the last highs from Friday and drifted below the 100 bar MA (blue line). Traders started to use the 100 bar MA as resistance (see chart above). The price did move below the 200 bar MA (green line) in early European trading, but could not keep the selling going. A move back above the 100 and 200 bar MA forced some shorts to cover. I would expect that. The market is still uncertain. The market still has some nervousness. Risk was defined by that level and buyers came in/sellers covered.
What was the next target on the move above the MA’s in the European session? The targets would have been the recent highs from yesterday and Friday (that makes sense). When the price failed to extend above those levels (see blue circle 3) and the price moved back below the 100 and 200 bar MAs again, the sellers returned.
Again, this is not surprising. Traders are keeping risk levels tight. They are looking for a momentum move but if it does not show, they get out with little risk (or sellers enter and short on the failed break). Technical levels – viewable to all – are seeing reactions(and an energy) from traders.When the price moved below the trend line, there was more downward confidence, with the 100 bar MA as the risk defining level. Sellers taking control.
Now what?
Over the last few hours the price has wandered lower. The next level of support comes in at the 38.2% at the 1.0039. Below that 0.9984. I would not be surprised to see patient buyers against the 1.0039 level (keep positions small and risk tight). The goal is to find good trade location, with limited risk. My thought is that 1.0000 might be a new floor. So I expect buyers on dips. Having said that, the upside potential will be dependent on getting and staying above the 100 and 200 bar MA (1.0138 and 101.60 currently) and then the 1.0221 area.
If you are inclined to trade the pair, be patient. Keep positions small and risk to 2% max on account. Follow the clues from what we have seen the market react to (the 100 and 200 bar MA and the ceiling, pay attention to the 38.2% retracement). Be sure to define your risk and keep risk/stops in place. If you miss a trade, because of the patience, don’t chase. If you get stopped, there is always another trade, but risk


