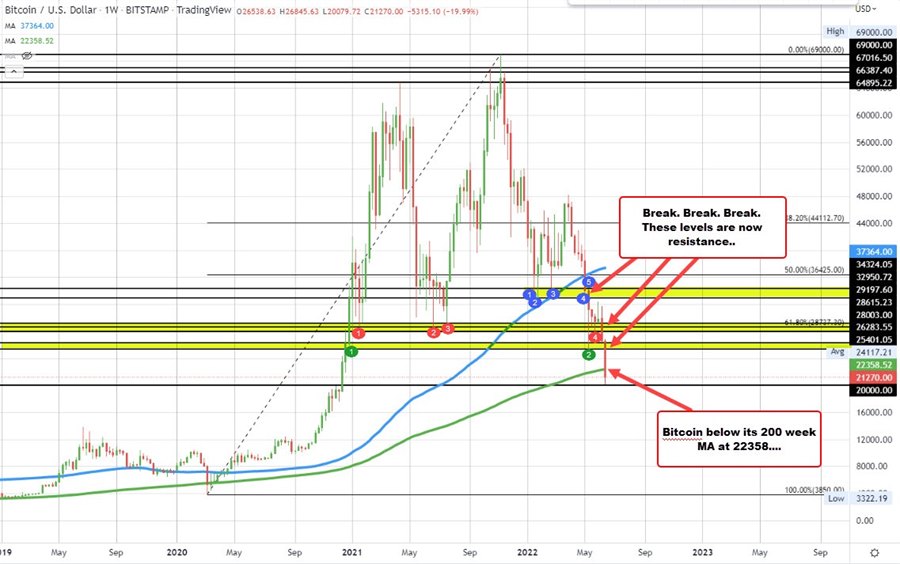
The price bitcoin is trading down around -$860 or -3.87% at $21,330.
Looking at the weekly chart above, the price moved down to a low yesterday of $20,079 which was near a swing high going back to November 30, 2020 (and close to the natural support at $20,000).
The price bounced off that level, but still remains below its key 200 week moving average. That moving average (green line in the chart above) currently cuts across at $22,358.54.
The price of bitcoin last moved below that 200 Week Moving Average way back on back in March 2020 at the start of the pandemic. The low price at that time reached $3850. A short 57 days later, the price peaked initially at $64,895. After a sharp decline toward around $26,200, there was a another surge to the upside that saw the digital currency top out at $69,000..
At the low yesterday at $20,079, the price decline from the high was around -71% or down around $-49,000. From peak. Hold on for dear life as they say.
Helping the move to the downside was the Celsius news over the weekend where the crypto currency lender stopped withdrawals. Crypto hedge fund Three Arrow Capital is facing insolvency following the latest crash according to Bloomberg news. You have to wonder if the 2 separate new stories are related. Celsius lends crypto to the "well capitalized" Three Arrow Capital, and then does not get paid interest or get the crypto back.
The 200 week moving average will help tell the story. A move above it at $22,358 is needed to give the buyers some hope. Absent that, and a run toward the $20,000 level would be anticipated.
Take a look at Ethereum , it too is lower on the day by about -$105 or -8.61% at $1103. Looking at its weekly chart, it too fell below its 200 week moving average this week (see green line in the chart below). That level comes in at $1195.62. The low price extended to $1012.72 yesterday. That was the lowest level since January 11, 2021 (all traders who bought after January 11, 2021 are underwater).
It will now take a move back above the 200 week moving average at $1195.60 to give the buyers some confidence/comfort. Absent that and the sellers remain firm control
Like bitcoin, Ethereum bottomed in March at a price of $100.60. The price peaked in November 2021 at $4867.81. Since then, the price has moved down from the high to the low reached yesterday by -79.2%.

It is always interesting to hear the commentary from digital currency experts saying how if an "investor" in digital currency, this is the time to buy.
The bullish pundits will also talk of the investment horizon of 5 to 10 years and how since the March 2020 lows, the price are still up sharply (which is true). However, they don't speak of the large number decline from the highs or how they touted the buy scenario all the way down.
Meanwhile sellers see the price going to $0.
IF a buyer, I would recommend to see a move back above the 200 week moving average and stay above that level first (and stay above) before getting all bulled up, but that would just be a start. Until then, hands off.