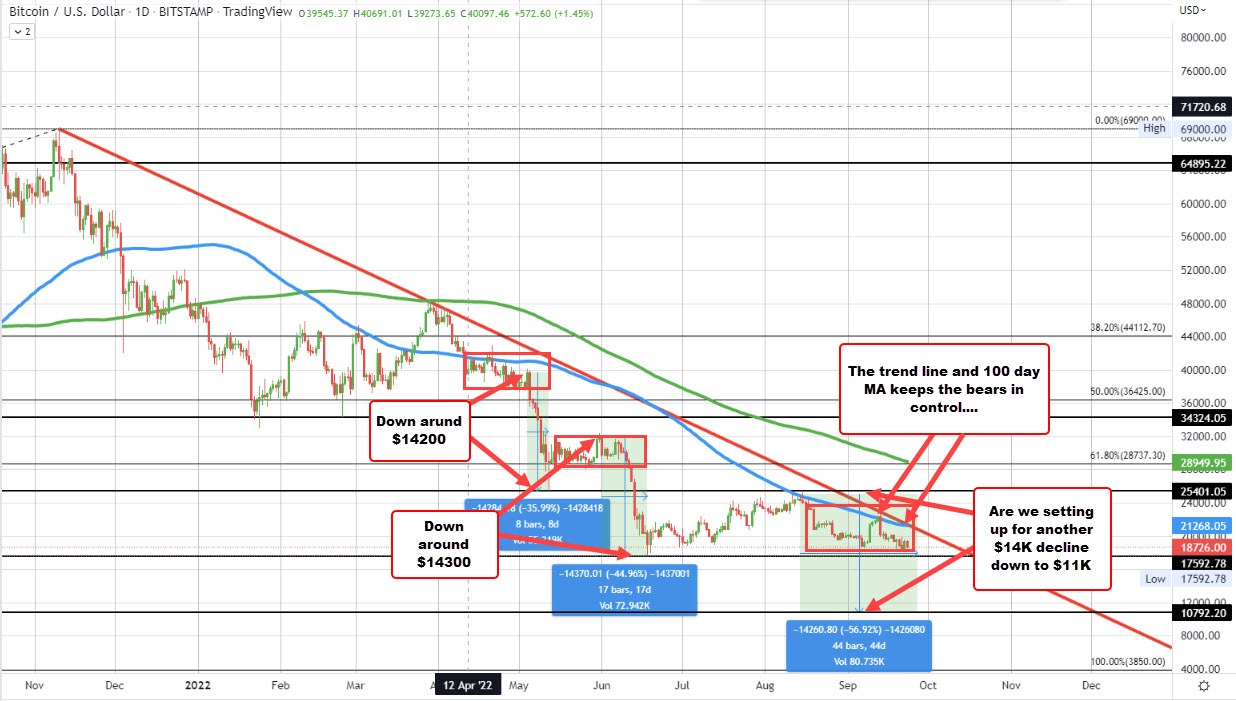
The price of Bitcoin has seen two quick $14K declines recently with one in May and one in June. The declines were quick. The market price consolidated after the moves.
Since June 19, the price has been consolidating between $17592 and $25400. More recently, the price moved up to test a downward sloping trend line. The move did move above the falling 100 day MA (blue line on the chart above) but could not sustain momentum (the trend line instead stalled the rally). Buyers had their shot above the 100 day MA. They failed thanks to the trend line.
The digital currency has moved back down toward the June low at $17592. The low this week got within $1000 of the low.
My question is "Are we in for another run to the downside?"
Given the consolidation, since June 19, the market may be ready. As mentioned as well, the buyers had their shot to take the price above the 100 day MA, but found willing sellers at the trend line. Bearish.
If the price is to go lower, all bets would be off if the price were to go above the 100 day MA at $21268. That is near the trend line too. With the price at $18664, the risk is somewhat high up to $21268.
Is there a closer risk level?
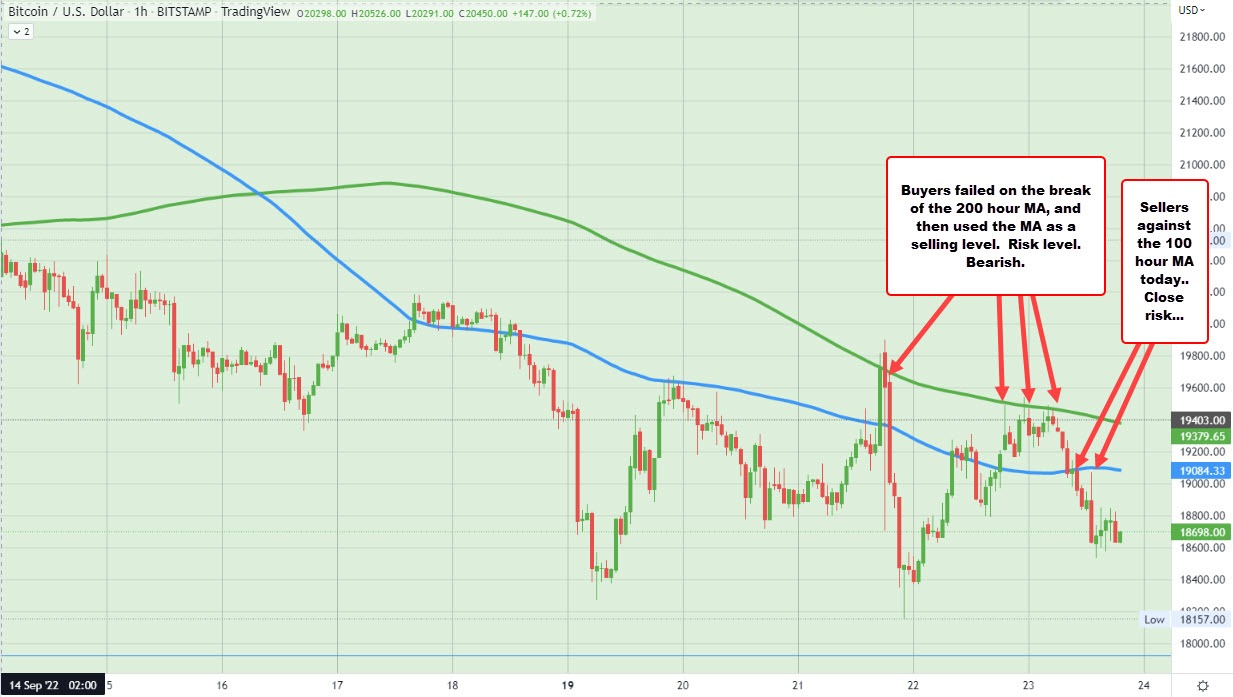
Drilling to the hourly chart below, the highs over the last few days moved above the 200 hour MA on September 21 but failed. Again buyers had their shot and missed. The subsequent highs on September 22 and today found sellers closer to that MA line.
As a result that MA would be a closer risk level at $19379. Stay below is more bearish. Move above is more bullish (stop). That is the risk.
A lower stop in the short term might be $19084 which is where the 100 hour MA is found. Today, the price moved below that MA and stayed below. That too is bearish and might be a closer risk defining level for traders looking for a quick opportunity.
Admittedly, those stopped can be triggered on a sneeze in bitcoin, but the idea is "it is time" The price action is talking to me.

Hey.... bitcoin is not the easiest to trade, but the technicals are technicals whether looking at Bitcoin, Microsoft, oil or GBPUSD. The chart looks bearish to me with defined risk against either the hourly or daily MA/trend line. The reward on a break to a new 2022 low could see the pair move toward the $11,000 area if the pair gets another head of steam behind it.
Time will tell but that is what the charts are saying to me.

