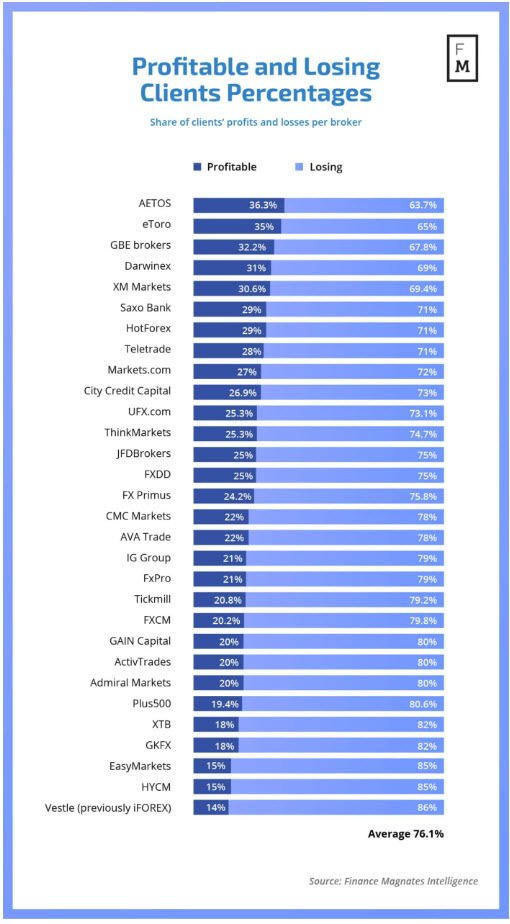
ESMA requires brokers to show the % of winners to losers
New ESMA regulations are now requiring EU regulated brokers to report data on trader success and failure. More specifically, they must report the aggregate % of winners and losers of their client base.
The first data points are in and it is a reminder to us all the difficulty of making money in the forex/ETF markets.
Below is a list of 30 brokers and their Profitable/Not Profitable percentages as put together by Finance Magnate Intelligence (see article here).

The broker with the highest percentage of winners was AETOS with 36.3% of their accounts with positive results. The one with the lower percentage was Vestle (previously iFOREX) with only 14% of accounts profitable.
The average of the 30 came in at 23.9%. Putting it another way, 76.1% of traders lost money. That is a stark reminder to us all of the difficulty of trading.
How do you get better?
Education.
Too many traders think it is a 50-50 "punt". If you are trading to satisfy a betting habit, stick to the casinos - you get free drinks there.
If you want to take trading a little more seriously, you need to understand not only how to trade, but how you can compete - especially if you are a retail trader - in the market.
One of the more respected traders in the FXL community, commented the other day that Forex = func(volume, time frame) ⊂ sub func( interest rates, political events, asf).
I don't know what asf is but those things are key cause and effect things to know. I might add that technicals play a key role too
Anyway, if you just focused on volume as a key function, it is hard to see the "volume" in the forex market. The so called "flows" may be seen by the professionals who have greater access, but for the retail trader, good luck if that is the most important thing for profitability.
So how do you compete if you don't see volume?
Well, if the there volume, the buyers or sellers are winning. If the buyers are winning, the price is going higher. IF you apply a technical tool that "many" buyers and sellers react, you now have a way to "see" the volume, and measure the bullish or bearish bias.
Nothing is perfect and different types of markets (trending/non-trending) are an influence, but when the 100 hour MA on the USDCAD stalls the fall and the price goes up, the volume is with the buyers (see chart below). They are winning. The volume pushes the price higher.

I don't see the volume. I am not at a bank seeing the buying take place. It is a global market. But I assume traders who win, want to define risk, limit risk at the 100 hour MA (blue line in the chart above). Why? If they lose, they "lose a little". If they win, they "win more than a little". When the price goes up off the MA level, that is "volume".
Now, when the price reaches the high from Monday and Wednesday at 1.31699-74 (see red shaded area), the volume comes in on the sell side. Why? Risk can be defined and limited at that level too. So sellers "lean" (volume overwhelms buyers) and the price goes lower. I don't see the volume, but volume is on the sell side against that level.
By knowing that, retail traders can compete. They can "see" (via the price action and the technical tools) the volume, without really seeing (not in parentheses) the volume.
This is just one piece of success, but to me, it represents a huge and important piece - especially for retail traders.
The 76% of the traders who lose, they are probably the ones selling at the 100 hour MA and buying at the tops because "they think" some story will play out. Don't get me wrong, those stories may play out, but if Forex - Func(volume, time frame) predominantly, your story does not address that key function.
What else causes traders to lose? Feel free to share your thought?
Once again, here is the link from Finance Magnates. It is a good one....
