Price action and tools are the answer
We are getting a pretty good squeeze higher (at least relatively) in the EURUSD. The pair has pushed above some key technical levels. It is not alone. The GBPUSD and the USDJPY (pushing lower of course) has also had "squeeze" tendencies.
All things come to an end. Putting it another way, "Trends turn to non trends". So how do you know when the squeeze is over?
For me, I need some proof. Mine comes from the clues from the technical tools and corrective price action. More specifically, I look for a correction of a trend leg that takes the price outside a 38.2-50% "correction zone". Let's look at the EURUSD example below.

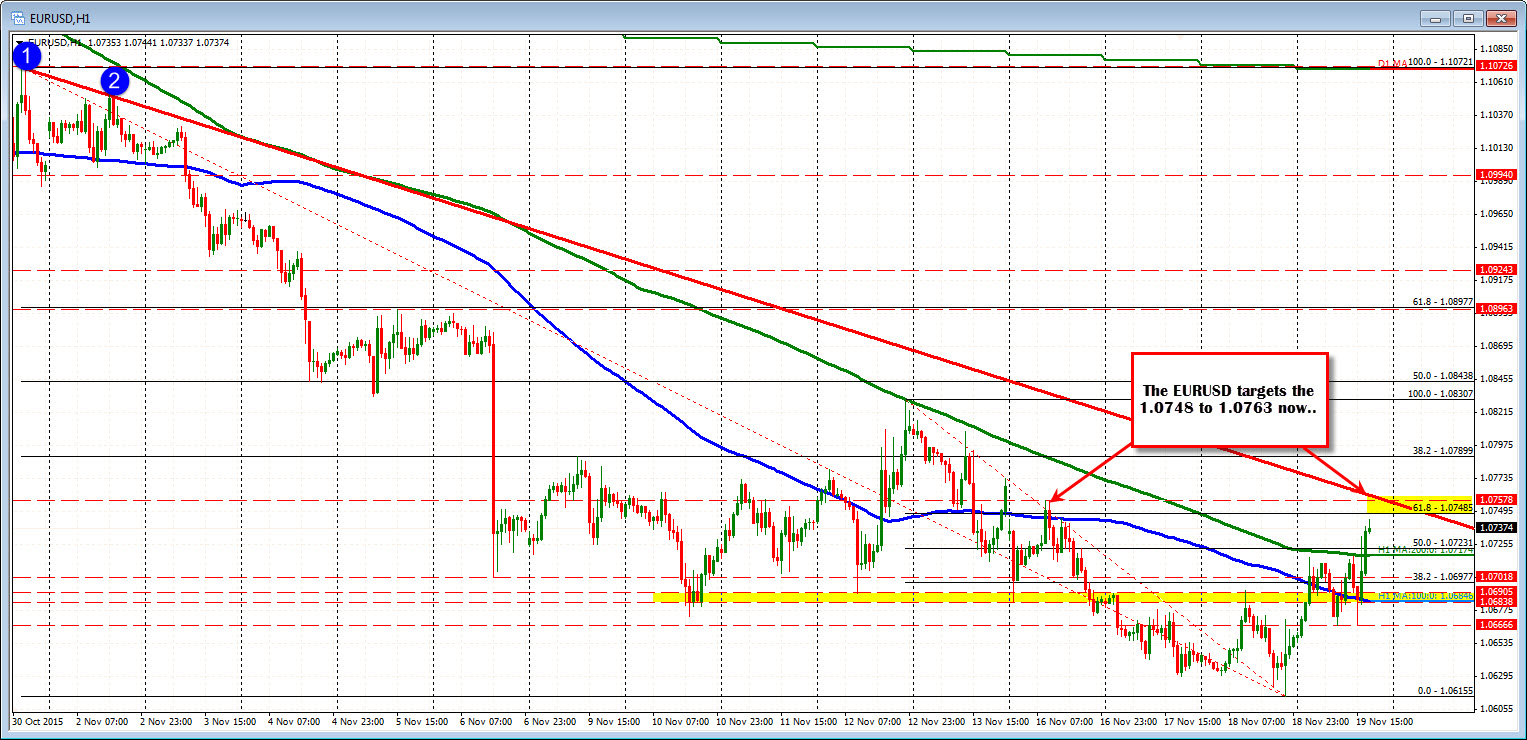
Looking at the EURUSD, the 1.0748-63 was a key target area (see post here).
Why at that level?
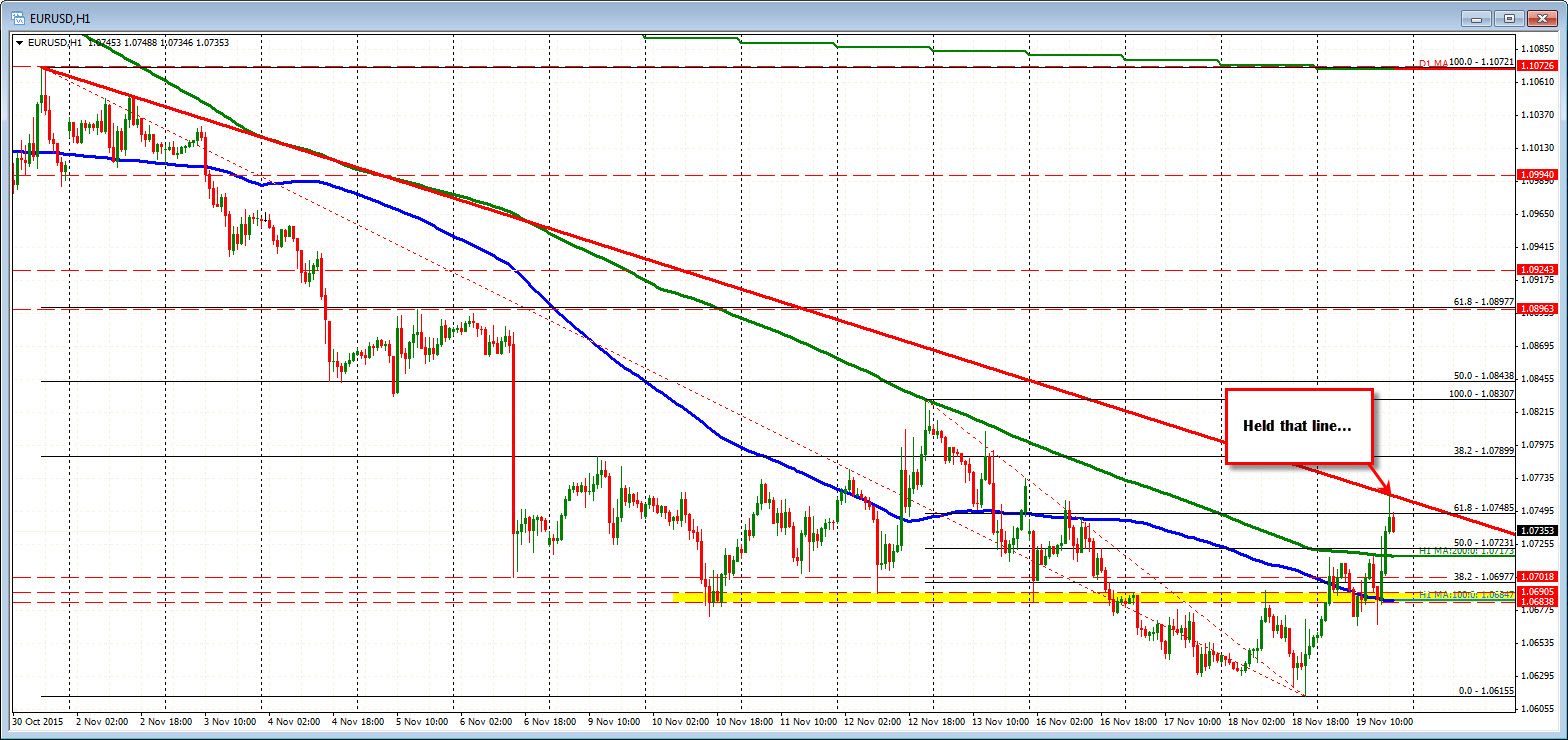
Well there were technical levels that many traders from around the world could see including the 61.8%, the swing high from Monday, and the trend line (see picture above). The range for the day at the peak was also up to 109 pips. The average is 104 pips over the last 22-days. So the market had reached it's par for the day. All that stuff at a similar area, tends to stall the market - at least temporarily.
Anyway, since there are a number of reasons to sell against the level, sellers entered and indeed pushed the price lower.
Is the high in place? Will it stop it in it's entirety?
Sellers against the trend line (and other resistance levels) are certainly hoping that is the case.
However, do we truly know this, or is it just another correction before a rally back higher? No. The market can simply correct, take another breather, before resuming the squeeze and the trend.

So what would give sellers more confidence the high is in place?
For me it is if the correction can get to and through a minimum correction area I call the "correction zone".
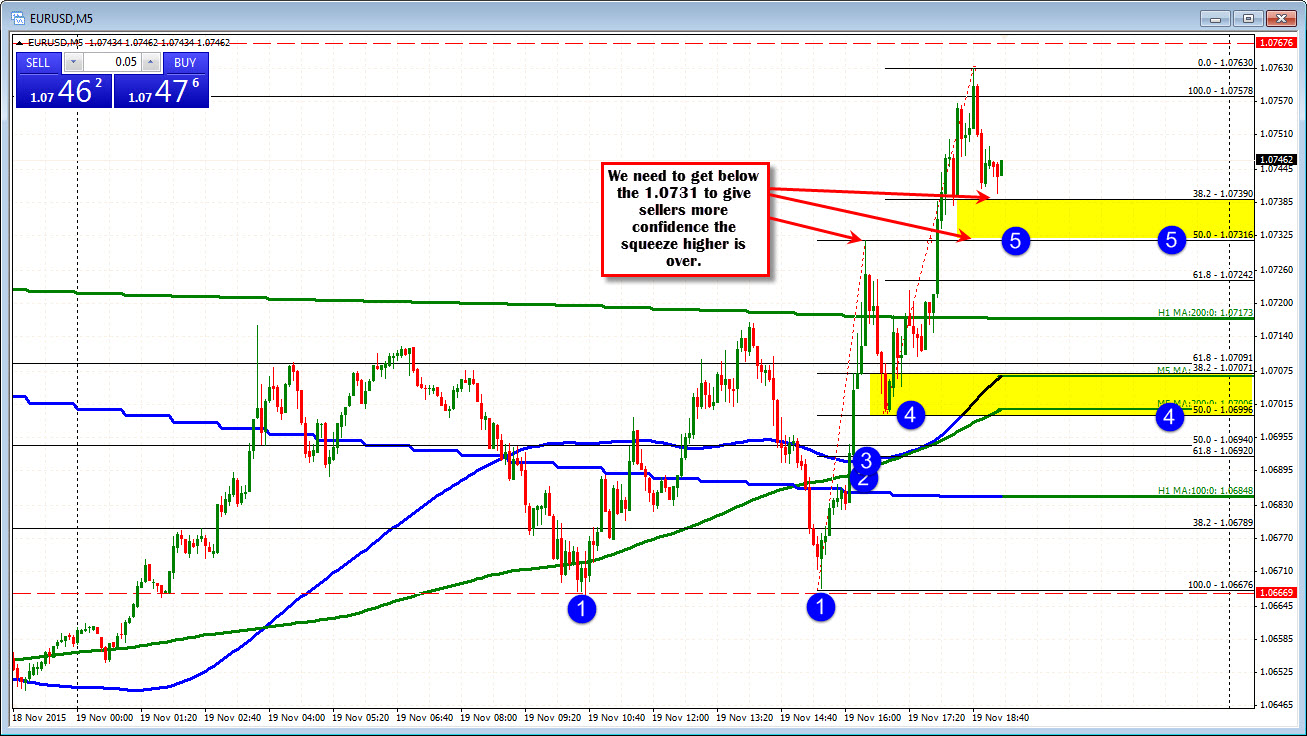
Looking at the 5-minute chart below, the squeeze higher today really started at the 1.06676 level (blue circle 1 in the chart below). That low could not take out the prior low, and the price started to move higher.
The 100 hour MA was broken next (blue step line in the 5-minute chart below), and the 100 and 200 bar MAs on the 5-minute chart were also broke in the same area (blue and green smooth line). That started the run higher (see blue circle 2 and 3). The bias was more bullish above these three moving averages.
That "leg higher" eventually made it's way above the 200 hour MA for the first time in a month at 1.0717 (green step line). That was a key resistance area. Traders realizing this slowed the rally and the price action did stall there.
What is important next is to note the correction off of that high. The correction lower came down into the "correction zone"defined by the 38.2-50% retracement of the trend leg higher, and held support (at blue circle 4). The inability to go lower, shows me, that there is buying interest on the dips. Stay above bullish. Move below not so bullish (maybe even bearish).
Note that from that corrective low (at point 4), the price moved back above the 200 hour MA again, and that led to the next "leg" higher. This current leg took the price to the 1.0763 target. Perfect level to stop.
But is the trend move higher over?
We really don't know yet. What might make sellers against resistance happy?
Sellers would be more happy, if the correction can take out the 38.2-50% of the last leg higher or "correction zone". Once again, that is the minimum that would have to be done to have traders say "The trend is over for now". That area comes in at 1.0731-39.
Get below that "correction zone area", and the pressure is off the squeeze (there still is good support at the 200 hour MA below but this is step one). Conversely, if that 50% can not be breached, you have to ask yourself "Are the sellers taking back control?"
My answer is always, "No, not really." I look for more of a squeeze.
So if you need an answer to the following question: "I wonder if this squeeze is over?" Just look for meaningful technical peak and then measure a 38.2%-50% correction zone from the last trend leg. If the correction zone area cannot be broken, the squeeze is not officially over. If it can be broken, think non trend. Think the squeeze is over.

