What you need to know about support and resistance levels in trading

One of the graphic analysis instruments is the analysis using support and resistance (S&R) levels. Today, I would like to speak about them in more detail. By the way, by the word "levels" I mean horizontal lines on the chart; as for inclined support and resistance lines, I will call them just "lines". I have specially mentioned this because some traders mix these notions up, which leads to misunderstanding.
In this article, I will explain the principles of drawing S&R levels, assessing their importance, and using them in Forex trading. I will also recommend some trading techniques that include this type of analysis.
What are support and resistance levels?
A support level is a "threshold" that the price has not been able to break away from above for a certain time; in other words, the price cannot fall below this level. On the chart, it looks as follows:

As we may see, the currency pair has approached the support level five times already but failed to break it away.
A resistance level is a similar "threshold", only the price cannot break it away from below; i.e. the price cannot grow higher than a certain level. Have a look at the chart:

Above, I have described the S&R levels formed by the instrument itself. Also, there are the so-called round levels, situated at round numbers, such as 1.3400, 1.6500, 1.2000, etc.
How to draw support and resistance levels?
You can draw a support and resistance level through just one point, however, this will have no practical use. Hence, we will be speaking about a support or resistance level in the presence of at least two points. Anyway, it is easy to see the price accumulated in one place on the chart; if you see such a cluster, where the price stopped moving and got in a flat, draw a support or resistance level, accordingly.
Always remember that S&R levels are not just lines but narrow ranges that the price cannot break away. This is the reason why we may not be sure about their placement at times - the pair might not completely reach it or go slightly further. So, I prefer to draw them in such a way that there were as many touches on the line as possible.
How to assess the importance of S&R levels?
You need to assess the importance of S&R levels to understand if they are worth including in trading and what trading decisions you should make when the price approaches them. To asses the importance, look at several parameters:
- The timeframe where the support and resistance levels are situated: the longer it is, the more important the S&R. Thus, trading hourly charts, take regular looks at the S&R levels on daily, weekly, and monthly timeframes. Trading intraday, you may scan the support and resistance levels that have emerged in the last 3-5 days.
- The number of touches of the levels by the price: the more frequently it touches them, the stronger the levels because the price is failing to break it away. Look at the last screenshot: the price touched the resistance level four times yet failed to overcome it and go on growing, which means the resistance level was durable enough. So, when the price nears it next time, we may count on a bounce, placing a selling order under it.
- The time it took the levels to form: the longer it was, the stronger the levels.
Features of support and resistance levels
Support and resistance levels feature several properties that we need to know and use in our trade not just as some supplements of your system but as a full-rate strategy.
- All support and resistance levels will be broken away sooner or later; however, keep in mind the possibility of a false breakaway (we will speak about them below).
- The price proceeds from one level to the other.
- After a
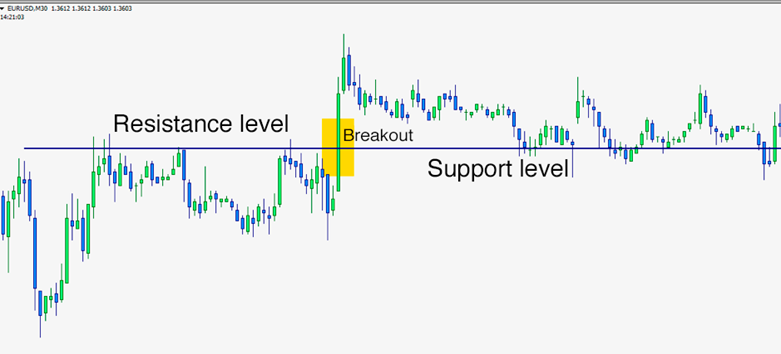
breakaway, support and resistance levels "switch polarity", i.e. the
support level becomes the resistance after the price breaks it away, and vice
versa; for example:

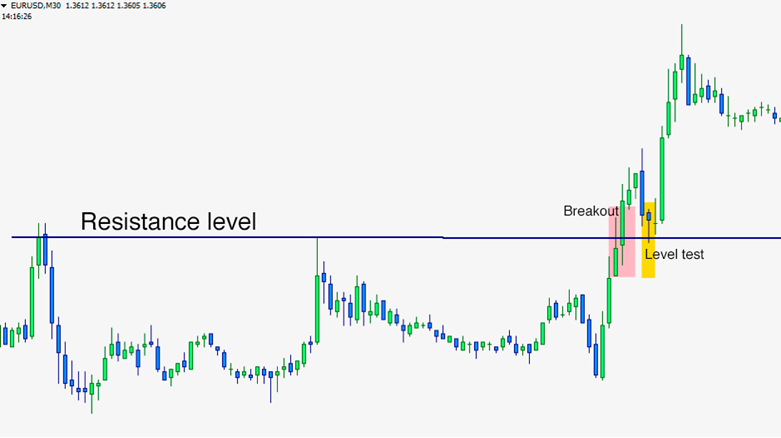
- After the price
breaks a support or resistance level away, it often comes back to test (touch)
it from the side of the breakaway, thus proving its validity and the change of
"polarity":

- The price "remembers" the strong levels it has overcome earlier. Thus, after an important support or resistance level has been overcome, do not delete it from the chart: later the price may account for it, and you will be ready, watching the level.
How to tell a false breakaway from a real one?
A false breakaway is such a breakaway after which the price returns behind it. Normally, false breakaways are performed by one candlestick on the timeframe on which the level is drawn. In our example, the resistance level is drawn on H1, and the false breakaway was also performed by an hourly candlestick:

False breakaways are meant for attracting more participants to the market. This happens as follows: while the price remains in a flat and keeps knocking against the level, most players wait for the price to determine its further direction, placing pending orders on breakaways or Stop Losses, or remain in the market, counting on a bounce off the support or resistance level. A false breakout grabs the pending orders and takes off the SLs.
We speak about a true breakaway when the candlestick that has broken the level away closes behind it. If the price returns to test the broken level, it will confirm the breakaway (as mentioned above): it will not happen necessarily but will be a trustworthy confirmation.
Hence, two points are important here:
- open the positions on a breakaway only when the candlestick that has performed it closes behind the level;
- trade on the chart on which you have drawn the support or resistance level, do not switch to a smaller timeframe.
Why do support and resistance levels work?
Paradoxically as it may seem, S&R levels work because traders know about and account for them. The price behavior is the market reaction to the aggregate of trading decisions. When the currency pair approaches the support or resistance level, traders asses the level and may take one of the decisions:
- close all positions fearing of a bounce off levels;
- open a trade counting a bounce off the level;
- place pending orders hoping for a breakaway;
- do nothing until the reaction of the currency pair to the level is clear.
Imagine what happens to the price if it approaches the resistance level, and all traders in buys close their positions, while the other part of the traders will open positions, counting on a bounce - a large volume of sales will push the price down.
Closing thoughts
If you learn to find and account for support and resistance levels and use them in trading, your work will become much easier, and you will be able to understand and analyze movements on the charts.
This article was submitted by Dmitriy Gurkovskiy, Financial Expert and Author at RoboForex Blog


