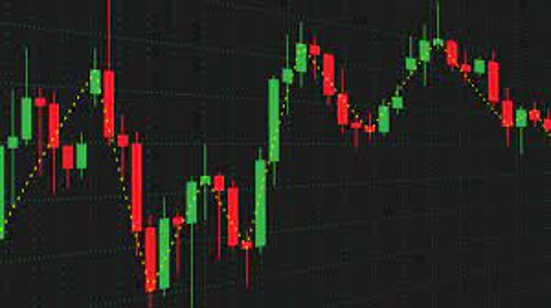
Understanding fractals in technical analysis

The fractal-based trading strategy is rather simple in use. At the same time, it might yield quite satisfactory results. Though in Forex, fractals are an indicator, I would call this strategy indicator-less. This is a rare case when the indicator does all the job for the trader. Fractals are very easy to detect.
How to detect fractals?
The Fractal pattern consists of 5 candlesticks. The first one is a fractal candlestick. It must have two more candlesticks to the right from it that will not violate its borders. After two candlesticks form at its sides, the fractal is considered complete; if any of the candlesticks break the border of the fractal candlestick, the pattern is considered erratic.
What is a fractal border?
Fractals can be upper or lower. In case of an upper fractal to be complete, two candlesticks to the right and left from it must not violate the upper border of the pattern. Here is a picture of the pattern.

At first glance, it is quite sloppy. I have marked each pattern by a different color. Each square contains five candlesticks: the fractal one in the middle and two at each side, remaining within its borders. I have done this to show you that a fractal candlestick of one pattern can easily be just a side candlestick in another one. They help us catch the direction of the trend and place a Stop Loss. Generally speaking, you can calculate them yourself, and if you have enough experience, you will see them without indicators. That is why I call the strategy I am describing an indicator-less strategy.
Trading breakaways of fractals
The main characteristics of the strategy are:
- Currency pairs: multicurrency
- Timeframes used: M30, M5
- Instruments used: Bill Williams's standard Fractals
Detecting the trend
Start your analysis on an M30 chart. The first thing to be done is to find the last broken fractal. The direction in which it has been broken is the direction in which your entry point must be headed. (See an example on the chart.)

As you can see, the last broken fractal is the upper one (enclosed in a red circle). The red line is its upper border, broken by the price. Here, you should be looking for entries to a buy because the situation indicates an ascending move.
Looking for an entry point
After you have made up your mind about the direction, you need a correct entry point to place a pending order (I will be working with an example of an ascending move). For this, switch from M30 to M5. Then draw a vertical line over the current candlestick. Ignore everything to the right of the line. Focus only on that going on to its left - we are waiting for a lower fractal to form. After it is complete, draw a horizontal line over its border (low) and wait for the price to break through it. If this is not done, and new fractal forms, drag the line to its border and wait for a breakaway again. After the line is broken, find the last upper fractal and place a pending Buy Stop order at its border. A Stop Loss should be placed at the previously drawn horizontal line.
Here is an example on the chart:

In the picture above, almost everything about Forex fractal-based trading is made clear. You need to draw a vertical line after a certain move. Then a lower fractal formed, and at its low, a horizontal red line was drawn. Then it was broken, and at the high of the last upper fractal, a green Buy Stop order was placed with a Stop Loss at the high of the last lower fractal (I highlighted it by a blue line).
Also, there are situations when you need to move pending orders. In the example above, you might need this if new upper fractal forms - then you will need to bring the pending order to its high. With shifting the SL, it is the same: if a new lower fractal forms, you will need to place an SL at its border. The new fractal can form either above or below the first one.
Following the trade
The main of following trades by the Forex fractal-based strategy is transferring positions to the breakeven. After the pending order gets triggered, and the price goes in the necessary direction, check for new fractals at the side of the SL. In our example, we have a buying trade, the SL is at the border of the last lower fractal, and as soon as a new one forms, drag the SL to its border, and go on like this. Also, you can use the pivot of the day as the goal; if an open trade is transferred to the next day, the next pivot becomes the goal.
By Dmitriy Gurkovskiy, Chief Analyst at RoboForex


