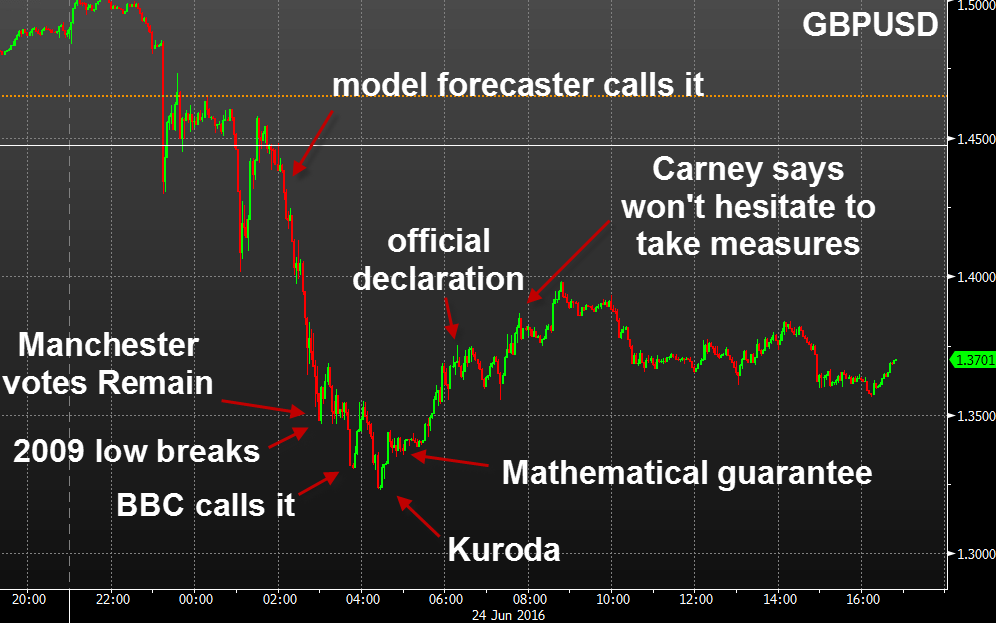
The annotated GBP/USD Brexit day chart

Maybe it's a early to take lessons from Brexit trading but it's tough to track down the levels and headlines years later, so here's a quick one.
At the low of the day of 1.3229 in GBP/USD it was down 11.92% from the highs of 1777 pips. That would have made it the worst day in history for the pound and that may yet prove to be the case with a few hours of trading left (although cable is on a nice little rip at the moment).
The trade was obviously to short at many different times but what was the cue to get out?
At the very bottom at 0427 GMT, Kuroda was on the wires saying the big 6 central banks will do utmost to provide liquidity and will work to guarantee stability of financial markets. That may have helped but they're relatively predictable comments.
At about 0320 GMT, the BBC declared the win for Leave other networks were around the same time. That's when a round of 'buy the fact' hit.
There was one more final downdraft after that but it was a solid sign of the bottom. More buying came in after the Leave vote was mathematically guaranteed.
For more on the Brexit trade and how it went down in real time, see here.
The lesson: The highest chance of a turn is always when expected news is officially announced.
