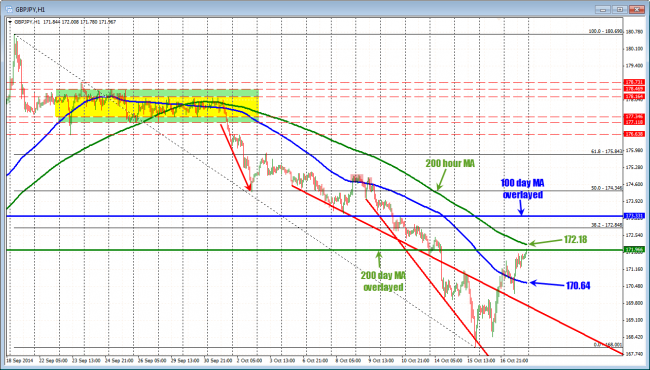
The GBPJPY has been trending lower since the consolidation break out on October 1 (remember that trade setup?).

The price of the GBPJPY has not traded above the 200 hour MA since breaking lower on October 1
On the way down, the pair had a few peaks above the 100 hour MA (blue line in the chart above), but restarted the trend lower on October 9. At the start of this week (especially Tuesday and Wednesday), the momentum accelerated lower as there was a flight into the safety of the JPY and the GBPUSD was also under pressure – falling below the 1.6000 level.
Then the market calmed down, and the flow out of the JPY pairs started to reverse as the stocks began to rebound.
Today, the 100 hour MA was breached once in the Asian session and after a correction lower, another time in the London session where it has remained. We are currently trading near the highs and look toward the 200 hour MA (green line in the chart above) at the 172.19 area. The price has not been above the 200 hour MA since breaking out of the consolidation back on October 1. It looks pretty good by looking at that chart alone. I typically will look for sellers out of respect against the 200 hour MA on the first test.
What does the daily chart say?
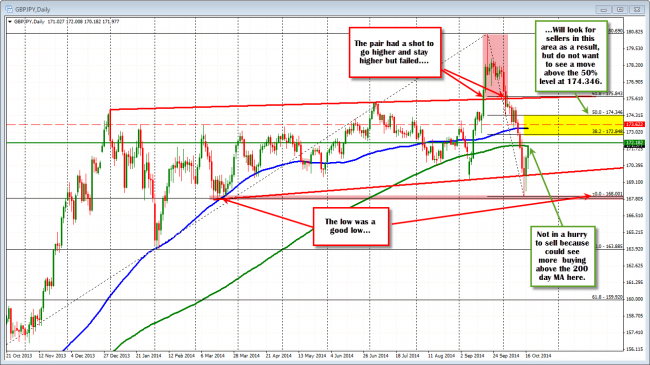
Looking at the daily chart we are heading into the close right at the 200 day MA (green line in the chart below). The 200 day MA was breached in September, and again this month. In September the price stayed below the 200 day MA for a total of two trading days. This current break we have closed below each day this week (today is still a toss up).
At the low this week we reached – and bounced off- the 38.2% of the move up from the June 2013 low (this was just an interim low before another trend leg higher). That low also corresponded with the low area from March 2014 (see chart). It was a good floor and good low.
So what to do now?
With the price near a key level on the hourly chart at 172.18, and the price right on a key level on the daily chart (200 day MA at 171.96), you can be long or short right here and be happy.
- Buyers want to see a break of the 200 day MA and then the 200 hour MA.
- Sellers want to see the resistance area against the 200 day MA and the 200 hour MA hold and continue the move lower that was started in September.
- Traders with no position can wait until next week and let the price action decide at that time.
Being square, I wait. Next week, I will be on the lookout for a test or failure above to sell. The pair had a shot to move and stay higher, when it took out the high in September. That failed. The low – albeit influenced by things like the stock market and all the other fears this week – was a lower low. I think that combination should solicit sellers on rallies. The high should be in place.
Am I in a hurry to sell? Not really. We could see some follow through buying on Monday /early next week, with a higher stock market perhaps. The 100 day MA at 173.32 and the 50% of the move down at the 174.34 would be a levels to lean against on a rally.
What I would not want to see with the bias outlined, is a move much above the 50% at 174.34. That would be the line in the sand from the short side that would say, “stay away, you are wrong”.
If we don’t get above the 200 day MA in early trading next week, the trade will be to sell with the new “line in the sand” being the 200 day MA.

The price is ending the week right at the 200 day MA. Next week could see more upside still.
FOREX EDUCATION:: Friday afternoons in the NY session are not always the best times to initiate a new trade – especially in more volatile currency pairs like the GBPJPY. Liquidity risk is high. Weekend event risk can be high as well. Traders who initiate trades on late Friday are simply trading when risk is elevated. If you are tempted to get that last trade in for the week, ask yourself, “Will I get another chance on Monday?”. If the answer is “probably” you may miss a better trade location occasionally but you may regret it too. The added benefit is you will likely have a more stress free weekend.


