
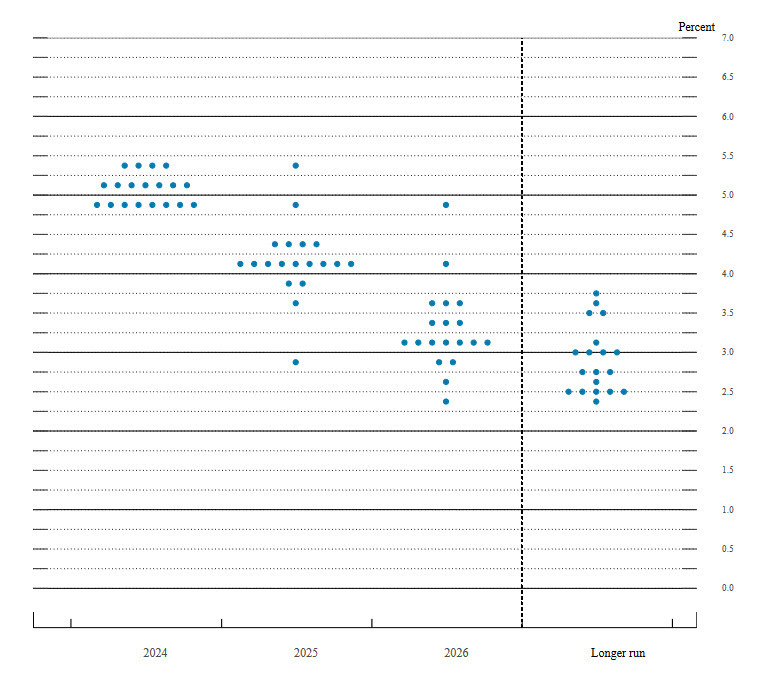
What do we make of the new dot plot on Wednesday?
The Federal Reserve is due to release another edition of its forecasts around growth, inflation and -- most importantly -- where Fed funds are headed. At times, the market takes the dot plot as guidance on what the FOMC will do at future meetings, and at the September FOMC, the dot plot is always telling because there are only two more meetings left this year. That means it's an opportunity to tee up what's coming at the November and December meetings.
What's the pitfall? Well, we don't have to look beyond the most-recent set of quarterly projections, which were released on June 12. That dot plot showed just one rate hike this year at the median compared to two hikes previously shown. It was a hawkish turn that rattled the market.
The problem is obvious. The Fed is going to cut by 25 bps or (more likely) 50 bps tomorrow and will assuredly continue to cut through year end. That means a minimum of 75 bps of cuts are coming and the market is pricing in 117 bps of easing.
To me, the message is that the dot plot is certainly not written in ink, more like written in sand ...and on a windy day.
History tells much of the same story. During the 2014-2019 period, the Fed consistently overestimated rates in the dot plot. That was flipped post-pandemic when they underestimated rates. I think we're back in a pre-pandemic period of low rates and low inflation but some may disagree. Either way, the historical message is that the Fed is likely underestimating the magnitude of the cycle it's in, which is currently a rate-cutting cycle.
So a hawkish surprise would be if the Fed cuts 25 bps and signals 75 bps this year. Does that mean the market needs to price out 117 bps of easing this year and 245 bps over the year ahead? Hardly and that's particularly true if Powell says the Fed will do more if they see any deterioration.
Remember this line from Jackson Hole.

What about if they cut 50 bps and signal 125 bps this year? That kind of message would really go against history as it would be notably more-dovish than the market.
Going out further, I wouldn't see something less than the 245 bps priced in for the next 12 months as hawkish, rather it would be standard procedure. Even significantly less shouldn't raise eyebrows (though it will probably elicit a market reaction).
What actually matters in the dot plot
Simply, it's the forecasts. The Fed's Williams argued this over the past month as he noted that US unemployment was notably higher (4.2%) than in the dot plot:
- 2024 GDP growth median +2.1 vs +2.1% prior
- 2025 GDP +2.0% vs +2.0% prior
- Unemployment rate in 2024 4.0% vs 4.0% prior
- Unemployment rate in 2025 4.2% vs 4.1% prior
- 2024 PCE inflation 2.6% vs 2.4% prior
- 2025 PCE inflation 2.8% vs 2.6% prior
- 2024 core PCE 2.8% vs 2.6% prior
- 2025 core PCE 2.3% vs 2.2% prior
Inflation is also on track to undershoot those levels.
So what I will be watching for in the Fed's forecasts isn't a dot but rather, the forecasts on unemployment and inflation. If I had a seat at the FOMC press conference, I would also ask Powell how policymakers will react if/when it's clear those forecasts are off base.