
Five patterns for new forex traders
Being new to trading forex can often feel like wading out into dark choppy waters. It's intimidating, unknown and overwhelming. Continuing the water metaphor, the internet is sea of information regarding trading, reading charts and extrapolating information from them.
Figuring out the best indicators for your strategy and trading goals can take years of trial and error, fine tuning and endless small adjustments. You only just started trading a few months ago, trading with actual assets for even less, so you probably don't know where to get started. Luckily this article will introduce you to 6 indicators which are popular amongst new traders.
1. SMA - Simple Moving Average
The Simple Moving Average indicator takes the sum of all the closing prices of a specific time period divided by the time intervals. That makes it sound a lot more complex than it actually is, in simple terms let's say you want the SMA of the last 10 days, you would add the closing prices of the last ten days and then divide them by 10.
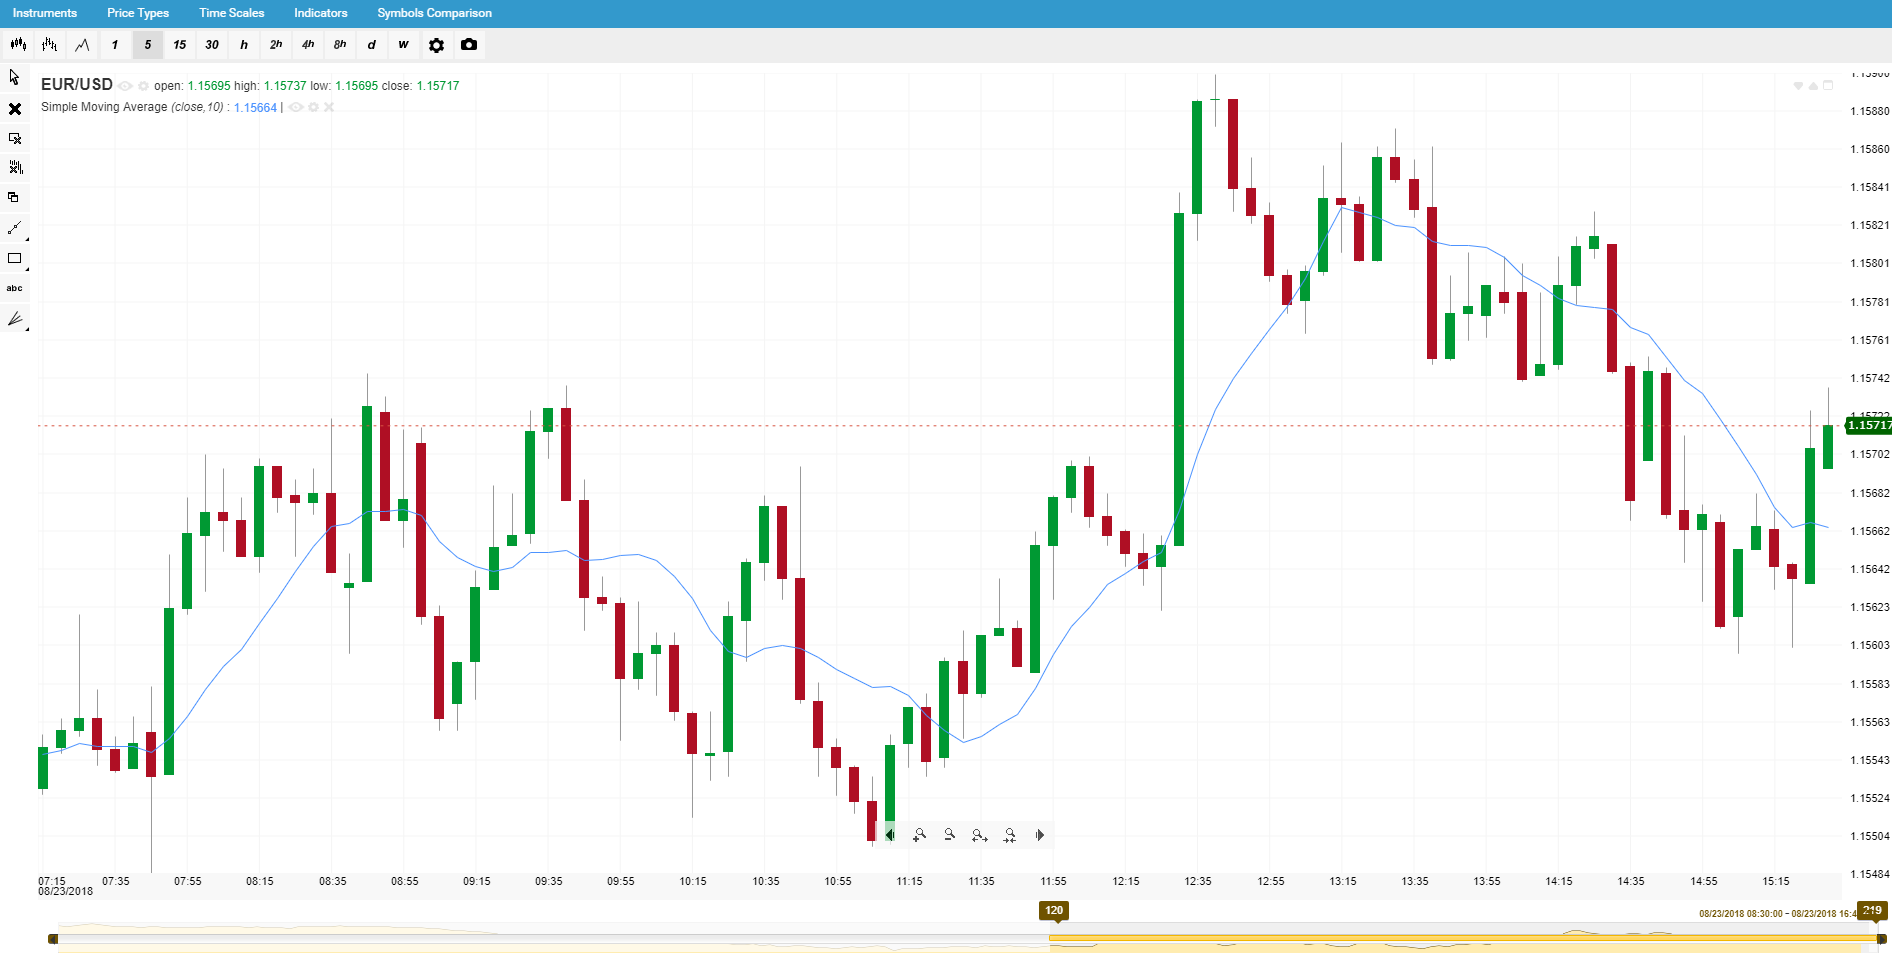
Depending on the time frame that is used to calculate the SMA it can show price changes rapidly - if the SMA is calculated on a short timeline or slower to react (but better at revealing long term trends) when the timeline is longer.
Short-Term
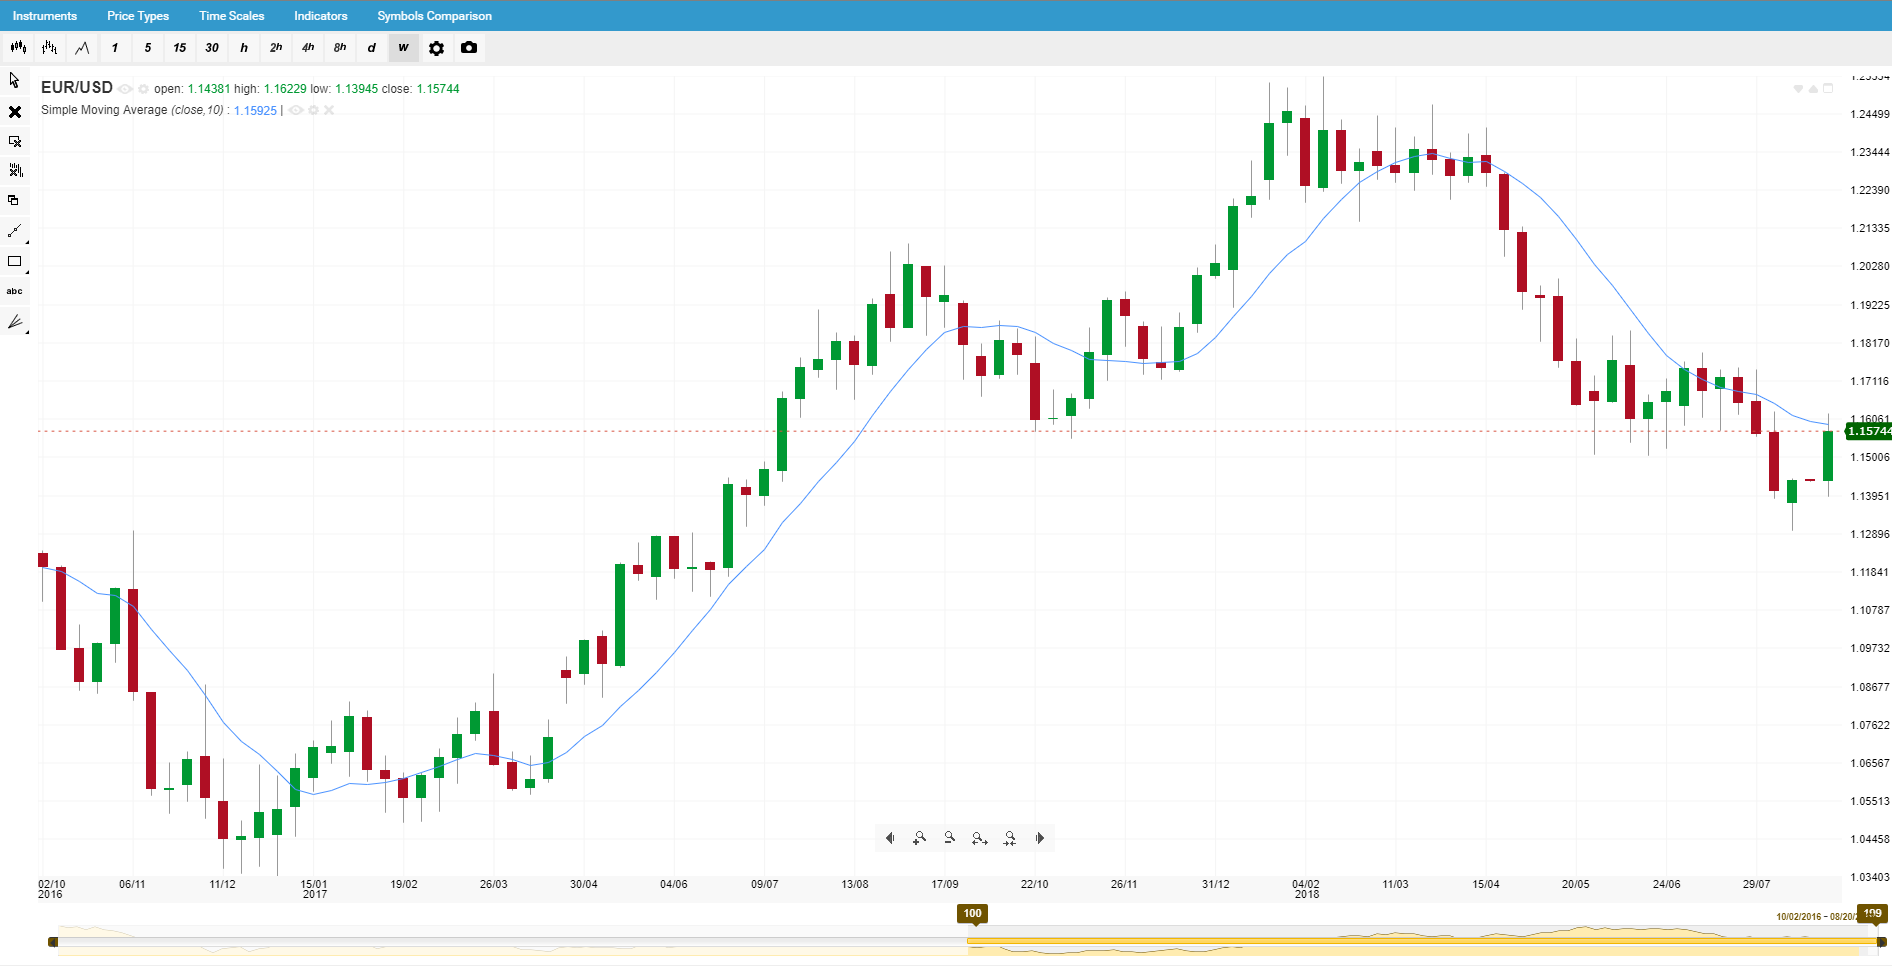
Longer-Term
As you can see the longer term SMA seems to "normalize" the price movement giving you a better gauge of emerging longer-term trends, where as the first shorter term SMA shows smaller fluctuations in the price, which is a better analytical tool for traders using shorter-term strategies such as intraday.
2..RSI - Relative Strength Index
As the name indicates RSI is a gauge of a trend's momentum that can indicate whether the asset being analyzed is in the overbought or oversold region.
The calculation of this indicator is relatively easy, please note that RS in the equation below is the Average gains during upswings/Averages Loss during downturns within the timeframe being looked at.
RSI = 100 - 100/(1+RS)
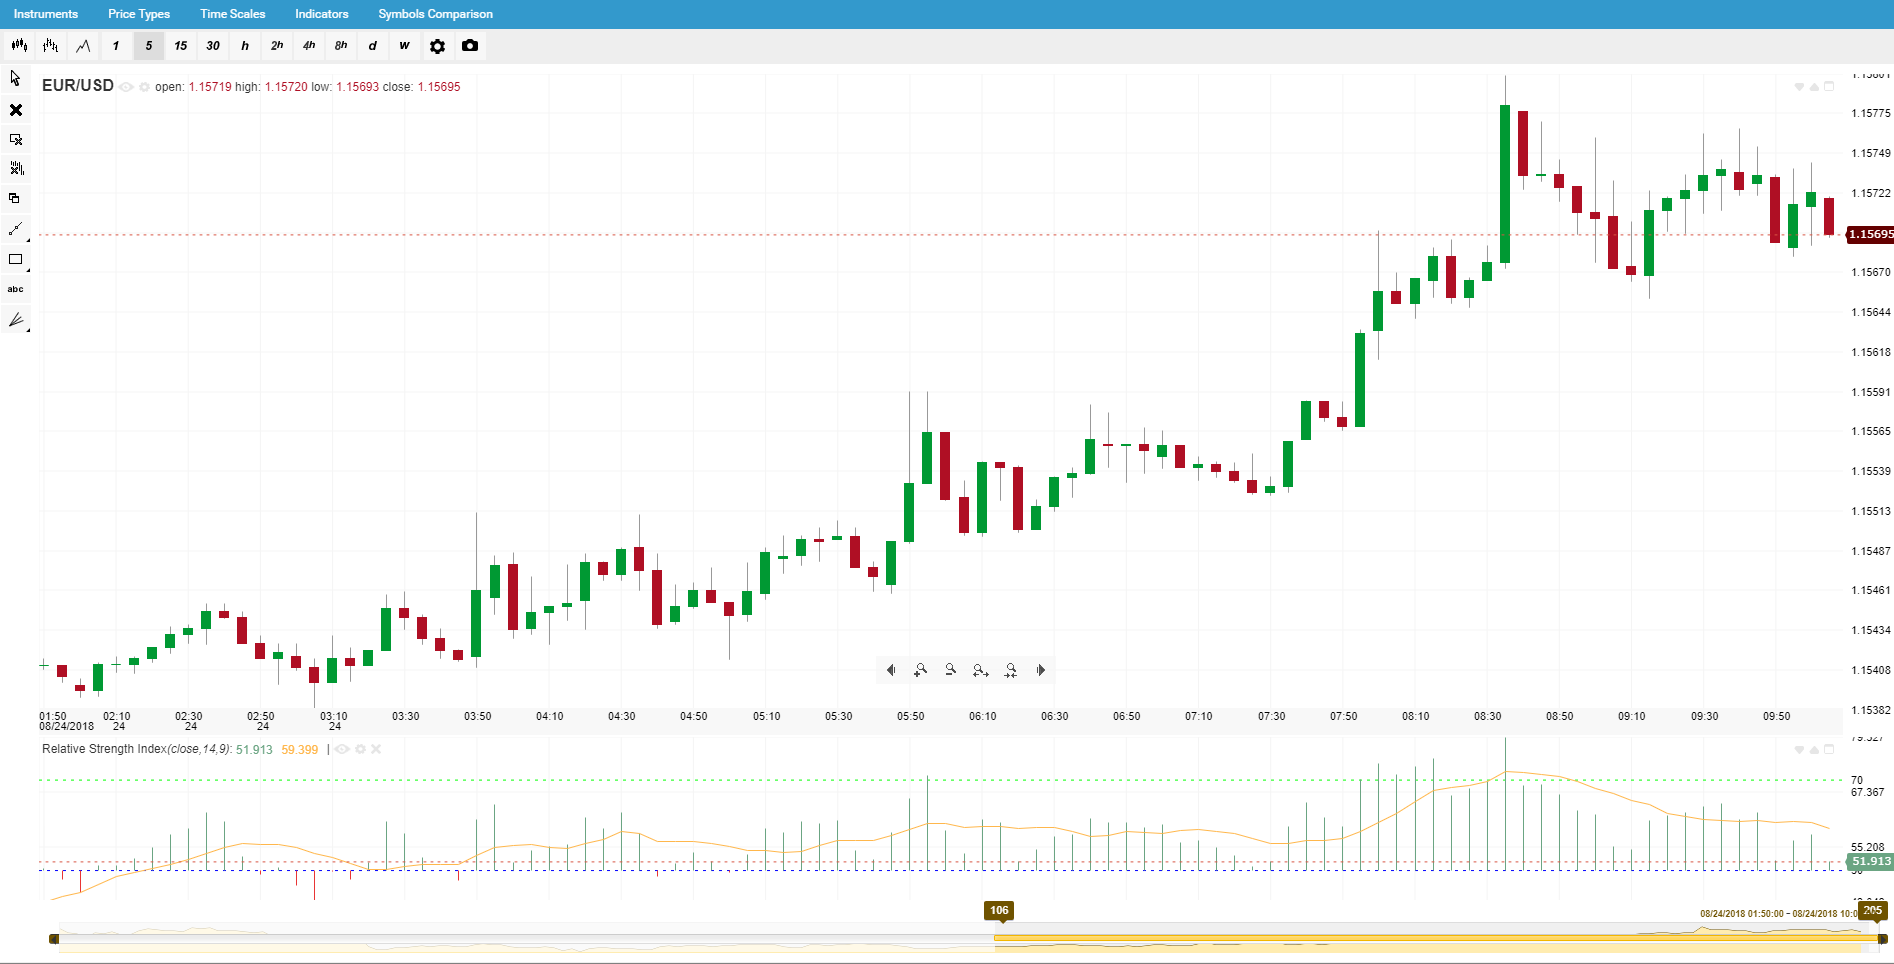
RSI oscillates between the range of 0-100 if the price moves below 30 that means it is in the oversold region, if the price moves above 70 that means it is in the overbought region. Why is this important though?
If an asset is oversold or overbought, there is high probability the current trend will undergo a reversal. Another way certain traders use RSI (cross-referencing it against other indicators to avoid false signals) is using a drop below 30 as a "buy" signal and a cross above the 70 level as a "sell" signal and anything in between a sign to hold the position.
3.Moving Average Convergence Divergence (MACD)
MACD is a slightly more complex in calculation and analyzing: it is the difference between an asset's 26-day and 12-day exponential moving averages and a 9-day EMA is plotted on the MACD also. These EMA's are a variation of moving averages that puts emphasis on more recent prices.
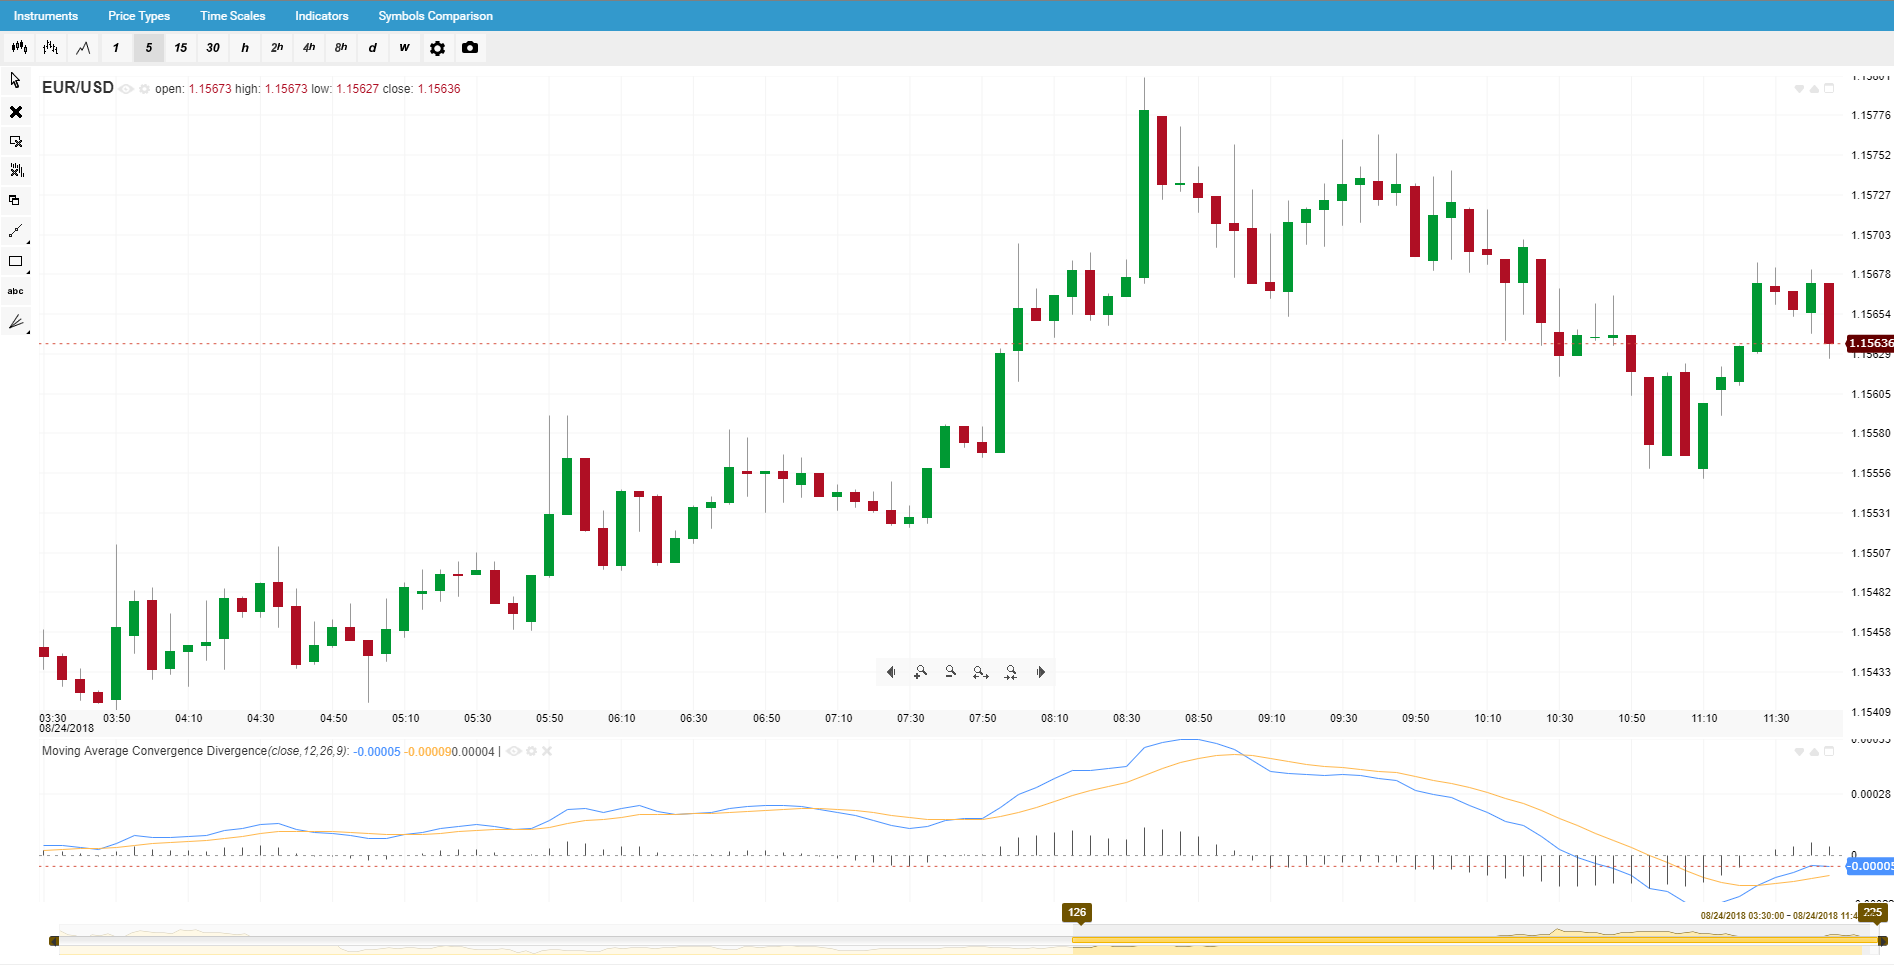
The MACD points towards a bullish trend when it moves above the 9-day EMA. As you can see in the image above, MACD indicator features a histogram, when the asset is in an uptrend it expands, whereas when its in a downtrend it contracts.
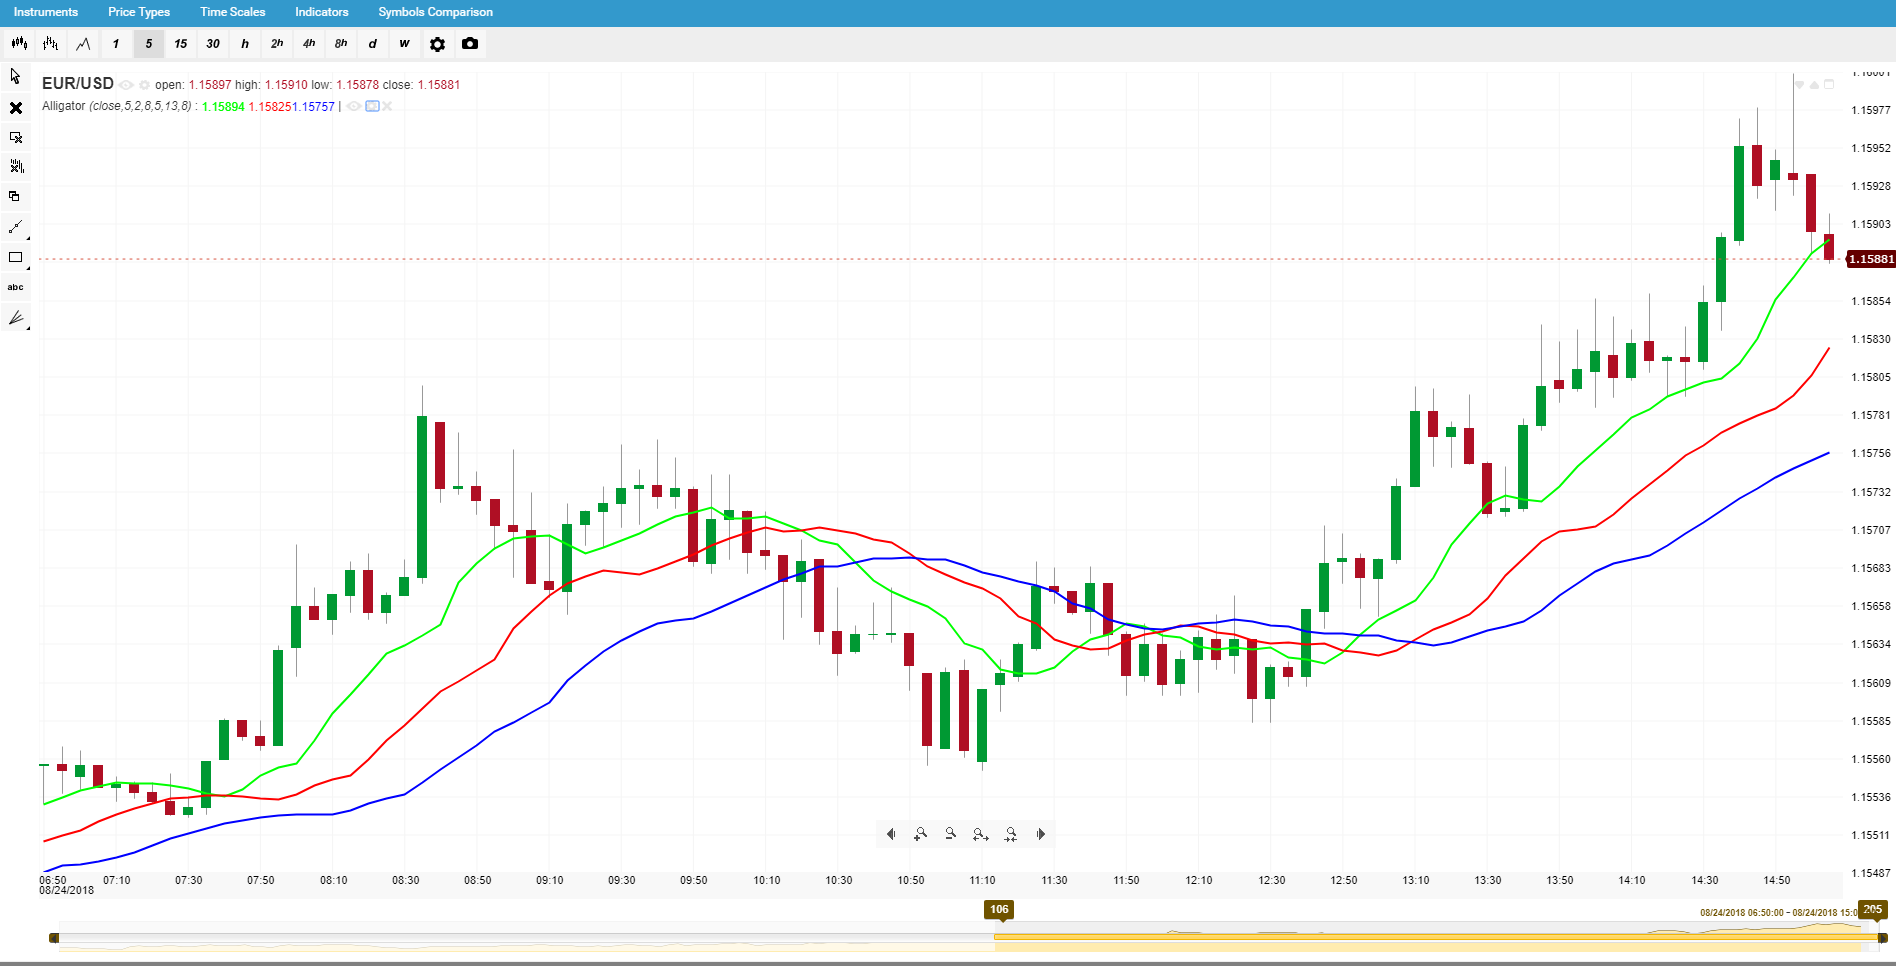
4. Alligator
Easily the most colorfully named indicator the Williams Alligator Indicator is composed of three normalized moving averages, calculated each to 5, 8, 13 periods which smooths out the indicator's movement.
This indicator uses a loose variation of the 80/20 principle, stipulating that the market moves - 15-30% of the time, the remaining time moving more or less sideways. The creator of this indicator believed that most traders (institutional or retail) exit positions at a higher frequency when markets are their most volatile.
The three parts of the alligator are similar to its terrifying real-world equivalent:
-Lips (the green) smoothed by the following three bars after a 5 bar SMMA
-Teeth (the red) smoothed by 5 bars following 8 bar SMMA
-Jaw (the blue) smoothed by 8 bars following 13 bar SMMA
As you might have extrapolated from the breakdown, the Lips move the quickest and the Jaw the slowest. If the Lips cross through the other lines downwards a short signal is given, if it moves inversely (from the bottom of the chart to the top) a long signal is given.
When the Lips are going down and cross the Teeth and Jaw the alligator's sleeping the opposite is the alligator waking up according again to the creator. When the three lines are spread apart moving up or down, this is the alligator eating with its mouth wide open. This gives the signal of a general continuing trend when position should be held - according again to Williams.
5. Bollinger Bands
One of the most popular indicators in recent years and is visually similar to William's alligator, but instead of using just moving averages with different timeframes, it also uses standard deviations to plot its lines. The reason many traders swear by the Bollinger Bands indicator is due to it giving more specific short and long signals (comparable to other indicators).
As you can see below where the high price crosses the upper band, a short signal is given and where the low price crosses the lower band, a long signal is given (highlighted by circles on the EUR/USD chart below).
Bollinger bands also occasionally act like support and resistance, like other indicator do (highlighted by squares below).
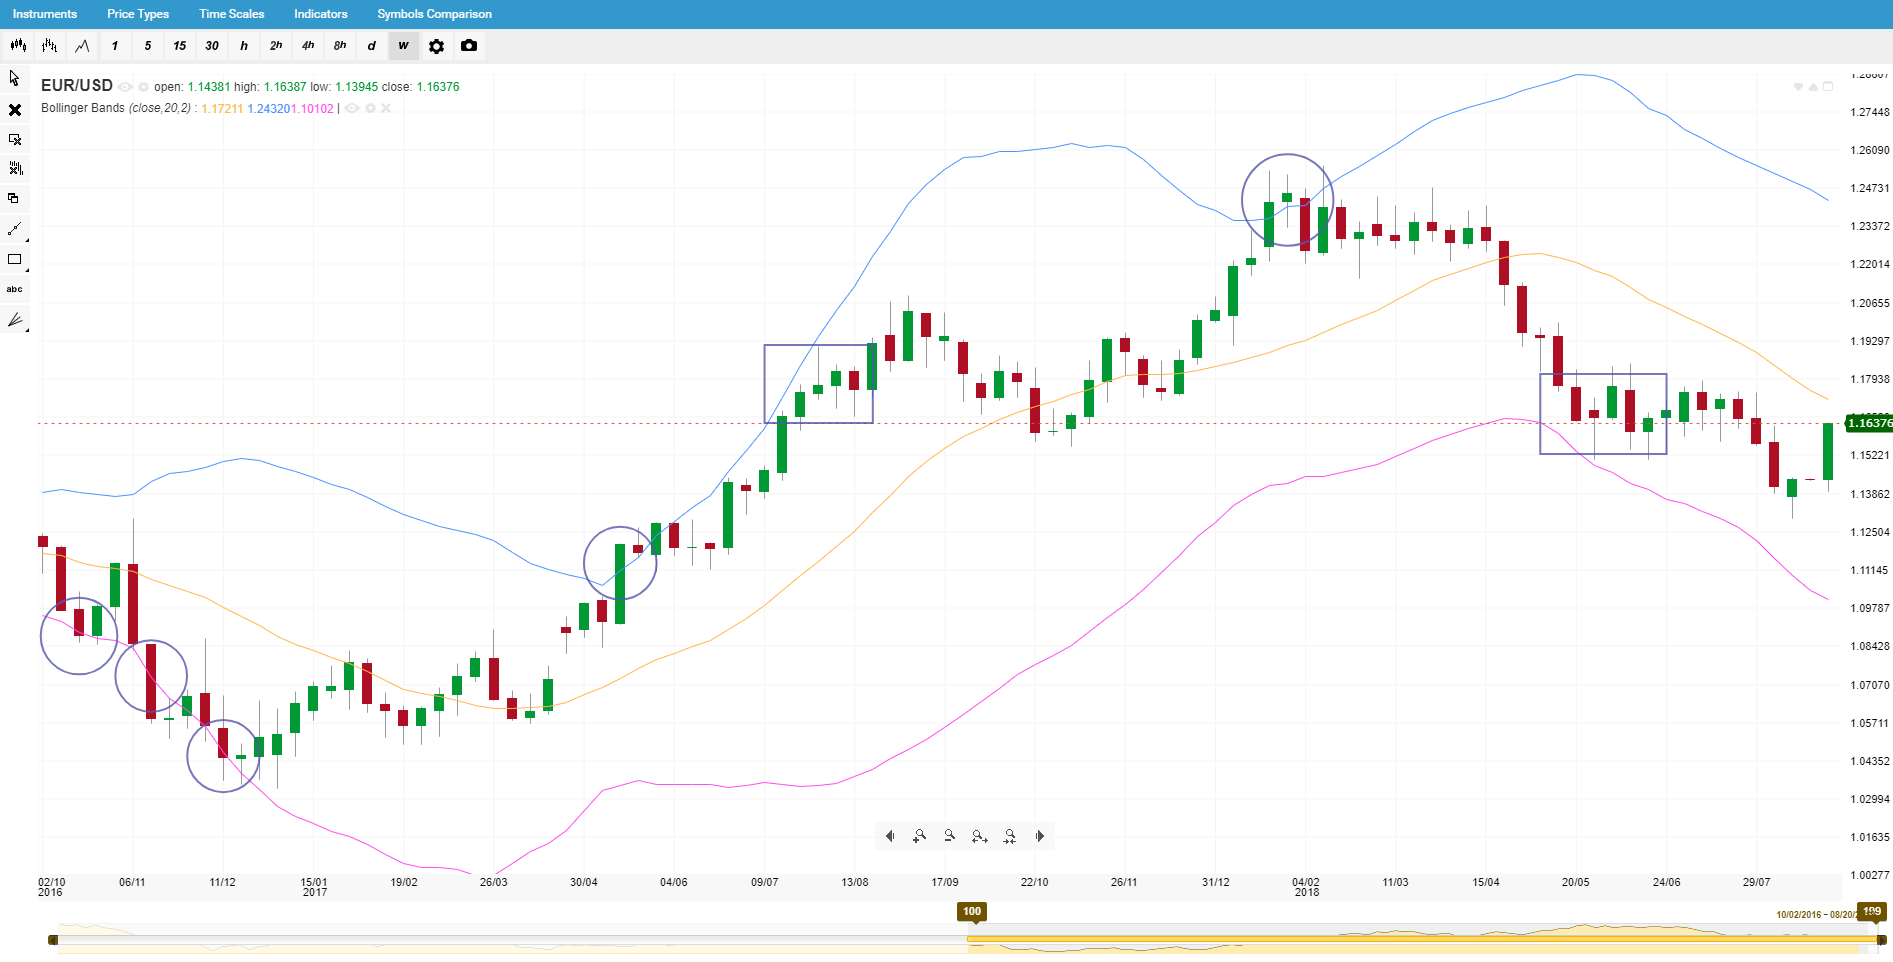
Bollinger Bands also help traders identify periods of volatility, as the upper and lower bands will converge when volatility is lower as they diverge when volatility increases. You can see that many of the signals in the chart above are given during what is called a "squeeze", or high volatility/time when the bands converge.
Beware of the False Signal
The reason that makes trading so exciting is the same reason that makes it risky - its volatility. A fool-proof method to give accurate signals have yet to be invented. If there was you probably wouldn't be reading this article, you'd be on the markets!
This is why most traders, analysts and general market-watchers use a combination of indicators to extrapolate data. To further protect themselves against false signals and market volatility many use risk management trading tools offered by Forex brokers.
Planning for success is probably the easiest part of trading but protecting your investment and trading account is the most crucial. So, no matter which combination of indicators you use, make sure you also have robust risk management strategy in place.

