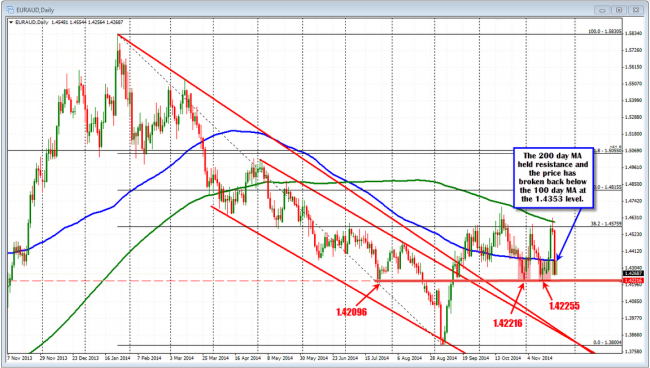
On Friday, I wrote the following about the EURAUD (refer to the chart):

The EURAUD on Friday had a bearish technical bias with support at 1.42096-225
The EURAUD is the weakest EUR pair. The price yesterday was testing the 200 day MA (green line in the chart below) and sellers entered against the level Today they were rewarded with a nice move on the back of increased QE speculation in the EU and the PBOC easing which is benefiting the AUD. The pair has tumbled below the 100 day MA (blue line in the chart below) at the 1.4353 level. The pair has been moved below the 100 day MA on two separate occasions in the last three weeks of trading – with lows of 1.42216 and 1.42255. Traders who are short will likely now use the 100 day MA as risk defining level with the hope the 1.4221 area is broken and a further move to the downside can be started.
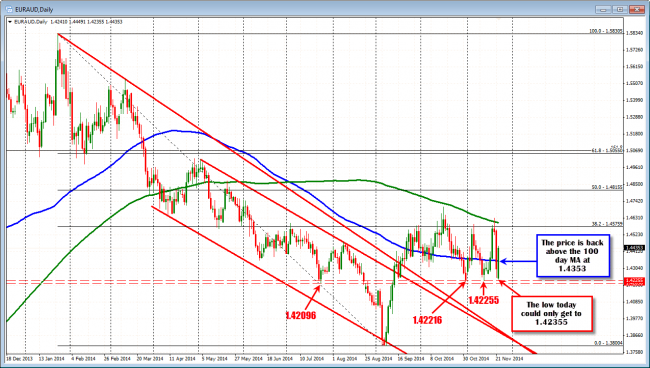
Today, that chart shows that the move below the 100 day MA could not get below the 1.4221 level (nor 1.4209 low either). The low today came in at 1.42355. The failure to get below that floor helped contribute to a rally back higher.

The EURAUD moved back above the 100 day MA.
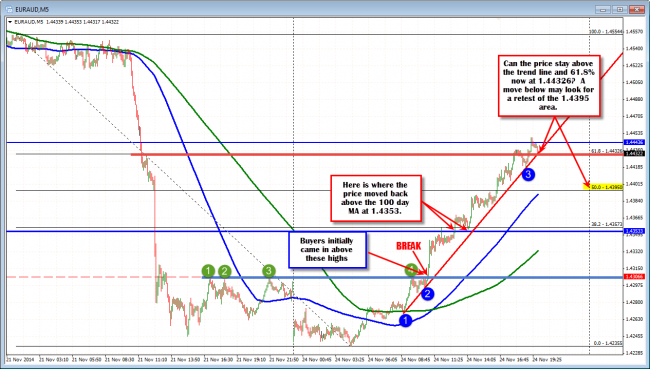
Looking at the 5 minute chart below, the price rally took the pair above an intraday ceiling at the 1.43066 area (see chart below). The next step higher shows the step above the 100 day MA at the 1.4353 level it was here the momentum trend higher started to pick up speed.
Currently, however, the pair is slowing with the 61.8% and the trend line slowing the trend a bit at the 1.44326. Is it time to sell/take profit?

Support is being tested.
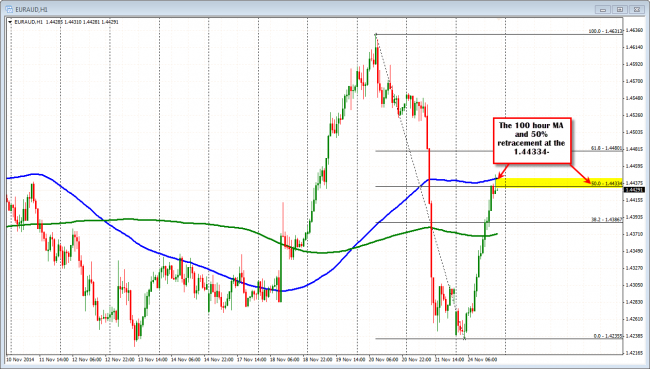
Looking at the hourly chart below, the 100 hour MA (blue line in the chart below) is at the 1.44445 level and the 50% of the move down from last week is close by at 1.44334. So there is a cluster of resistance which should slow the climb. Look for sellers here with stops above the 100 hour MA . If the price does decline, traders will target the 1.43867 and 200 hour hour MA at the 1.43718.

100 hour MA and 50% retracement give a couple reasons to sell.