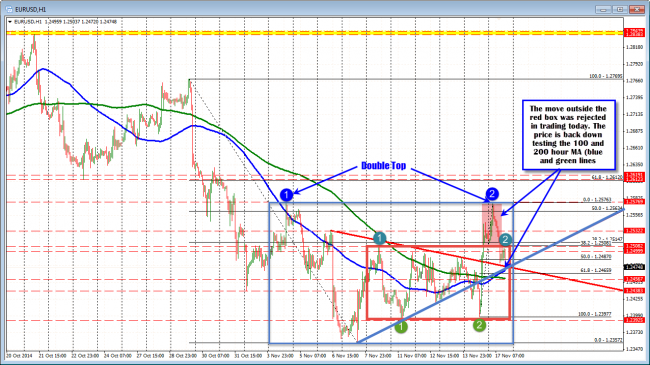
The EURUSD is back lower in trading today after the late Friday rally, and subsequent early Asian session rally which fizzled against the two-week highs at 1.25769 area. The German Bundesbank was less upbeat about the economic prospects. Trade data was a little better.
After the ECB decision and Draghi’s press conference on November 6th, the EURUSD price tumbled from 1.2525 to 1.23947 twenty minutes later. The day closed at 1.23728. The low for the month came in on November 7th at 1.23572.

EURUSD back in the box from last week. Tests 100 hour MA (blue line)
Looking at the hourly chart above, the current price is at 1. 2479 – at the low for the day but more toward the top of the pre-Draghi range from November 6th. The price is back below the October 3 low of 1.24999. and the 38.2% of the move down from the October 29th high to the November 7th low at the 1.25147. In between is the 1.2508 level. This level was the high from last week until the late Friday rally extended what was a narrow trading range (see Red Box in the chart above).
The price is currently testing the old trend line at the 1.2473 level (see chart above)and the 100 hour MA (blue line in the 1.2472. The 200 hour MA (green line) is the next target at the 1.2458 level. The range today is around 106 pips which is near the 103 pip average over the last 22 trading days (about a month of trading).
Taking a broader view, the pair over the last 2 weeks has the pair with two highs at 1.2577 area and a few lows near 1.23572 from November 6 and 7 (see Blue Box in the chart above). The inside Red box, is the range from last week before the late extension. That range has 1.2508 as the high and 1.23925. Moving out side the box will once again be eyed.
The look suggests to me that the pair is still in a land of confusion with regard to which way it wants to go. Putting it in different way, the low of the 6 day range was tested on Friday. the high of the two week range was tested today. The pair can not make up it’s mind which way it wants to go. Selling high and buying low becomes the option.
Fundamentally, the bias should remain more bearish (despite weaker US data today). The market is not reacting to the weaker Empire or Industrial Production/Cap Utilization numbers.
Technically, what should have been support at the 1.2500/1.2508/1.25147 now becomes resistance with a break of the 100 and 200 hour MA eyed and then the lows from the Red Box and the Blue Box. Can the downside momentum continue? It can, but it seems the market is already expecting it. So will new/more sellers help the momentum? Look for a break of the 200 hour MA (and staying below) to be the next confirmation that lower is still alive in trading today.