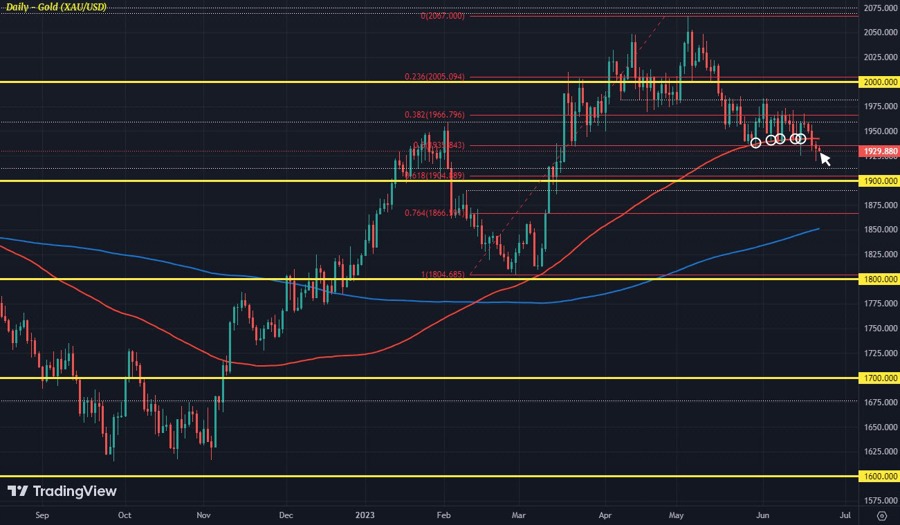
I probably don't have to keep hammering on this subject but the chart is certainly one of the more interesting ones to watch so far this week. Gold had held on to its 100-day moving average (red line) for a few weeks now and for that to give way, is stirring up some added downside momentum in the past few sessions.
The mood is looking heavy and while we haven't seen a quick run lower in prices yet, it may just be a matter of time.
Sellers are starting to exert their force and a trip to $1,900 next looks to be on the cards, at least from the technical story.
Looking over to the fundamental side, could it also be a case where gold is suffering from success? That's a similar narrative for stocks this week and that could be explained by a risk rotation flow into bonds with quarter-end approaching.
The run higher for gold in March to May perhaps argues for a bit of a pullback and with the technical development above, things are certainly lining up for a stronger correction now.
The $1,900 level will be a key test for buyers' appetite but I reckon there will be stronger desire to reload on longs closer to the 200-day moving average (blue line). I won't lie, that will include myself.


