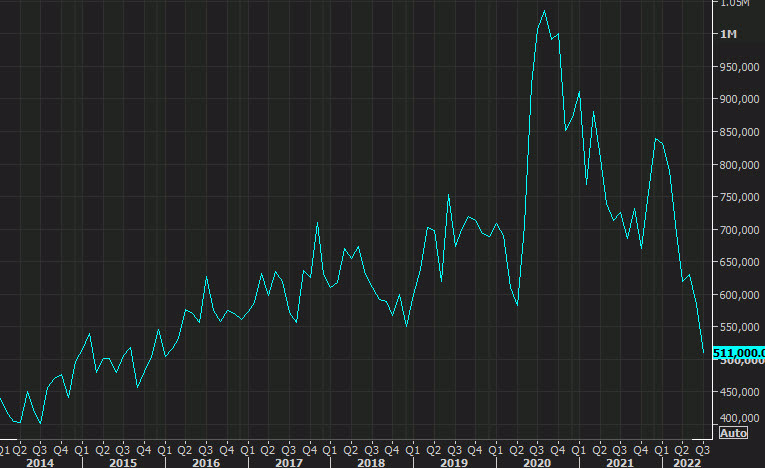
- Prior was 590K
- Sales down 12.6% on the month vs -8.1% prior (revised to -7.1%)
- New home supply 10.9 vs 9.2 months prior
- Homes for sale at end of July 464K vs 450K prior
- Median sale price $439.4K, up 8.2% y/y
Ths is the worst reading since 2016.
Despite that, there are signs that US housing is stabilizing with the inventory of homes for sale leveling off in other data sets.