
Up and down day for the pair
The AUDUSD has had an down and up trading day. Support held. Resistance held. The pair is ending near unchanged on the day, and awaits the April employment report that will be released in the new trading day.
What level will change the bullish or bearish on stronger or weaker data (see the Adam's fundamental preview here). The report will be released at 9:30 PM ET/0130 GMT.
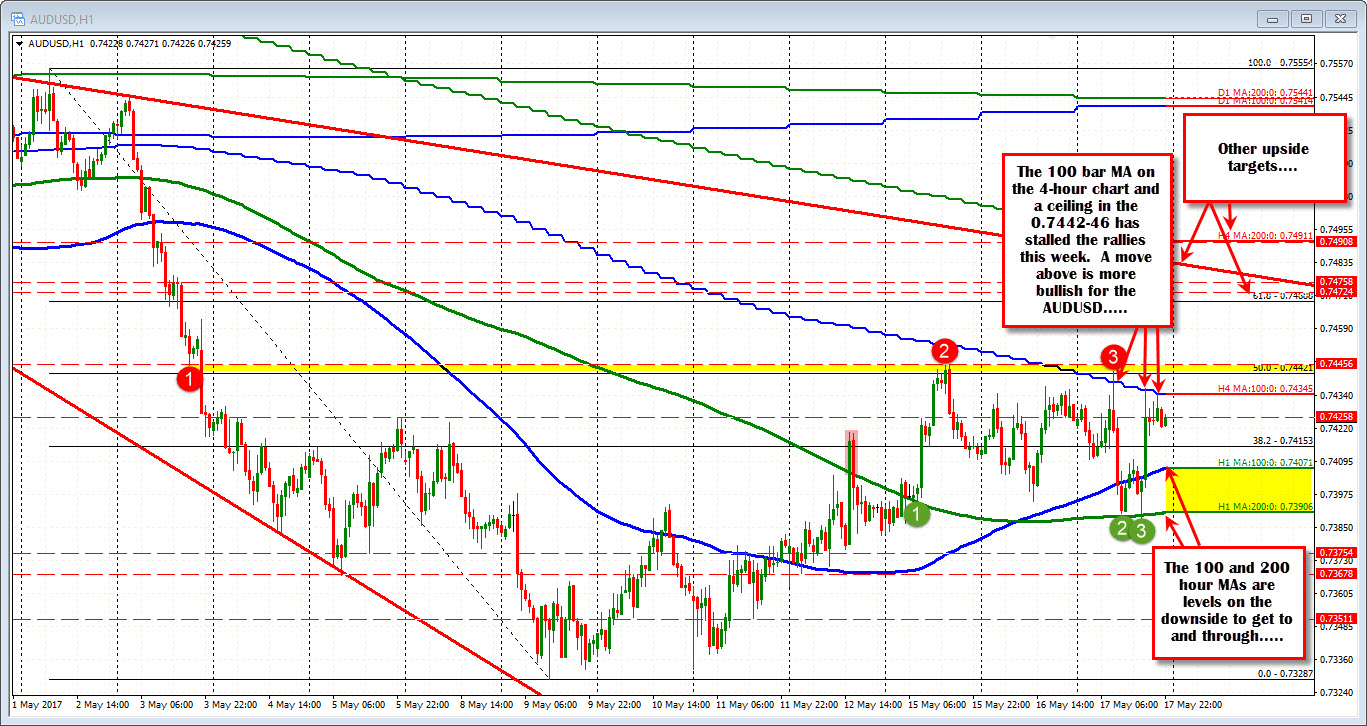
Looking at the hourly chart above, the high spiked up to 0.7443 today. That took the price above the 100 bar MA on the 4-hour chart at the time at 0.7439 and the 50% of the move down from the May 1 high at 0.7442. What the move did not do, was get above the high from Monday at 0.74456 (see chart above). As a result, the price quickly moved lower.
Where did it go from the failure at the high?
The fall off the high went back to the 200 hour MA at 0.7390 area (see green circles in the chart above). The market tested that MA level twice today. There was a tiny crack below that MA in the NY session on risk off ideas. However, "Risk off" turned to USD selling after the 2nd test of the MA support failed. The rally in the NY afternoon has stalled against that 100 bar MA on the 4-hour chart on two separate tests.
So going into the new trading day (and the data), the close battle lines are drawn.
On the topside:
- Get above the 100 bar MA on the 4 hour at 0.74345, the 50% at 0.7442 and the 0.74456 levels and the bulls are in control.
Targets include:
- the 0.74688 (61.8%),
- a trend line connecting March 30 and April 17th highs on the hourly at 0.7480, and
- the 100 bar MA on the 4-hour chart at 0.7491 become the upside targets.
On the downside,
- Get below the 100 hour MA at 0.7407, and then the 200 hour MA at 0.73906 (and stay below) and the sellers are in control.
Targets include:
- 0.73678. The low from May 5th and again on May 12
- 0.7351. Swing lows on May 10th and May 12th
- 0.7328. The May low from May 9th.
The price action in the AUDUSD are suggesting they traders today are simply buying some time and waiting for the data to give the next push. The sideways action since May 4th have helped define technical levels in the range that need to be breached. to help turn the bias more bullish or more bearish. It is up to the numbers now, and then the price action vs. the technical levels.

