Oil below $35
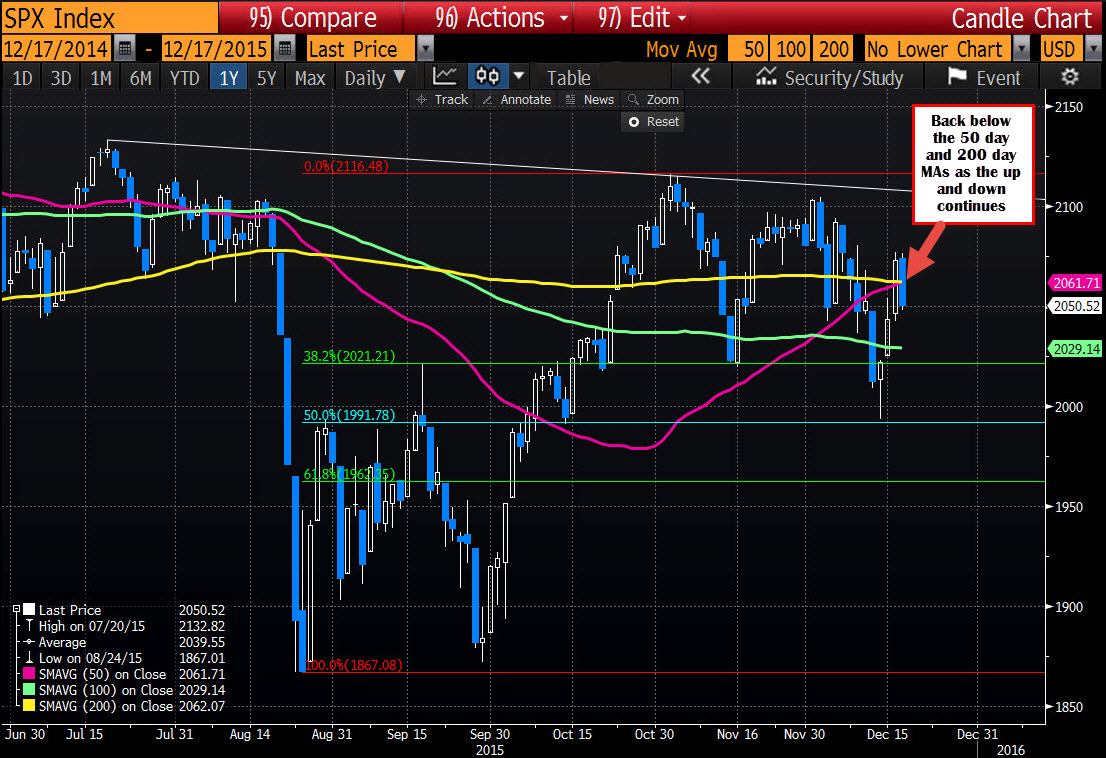
The S&P is trading near low levels for the day. ON the daily chart, the index is back below the 50 day and 200 day MA. The dollar is up. Oil and commodities lower. Stocks have been going lower recently on that recipe.

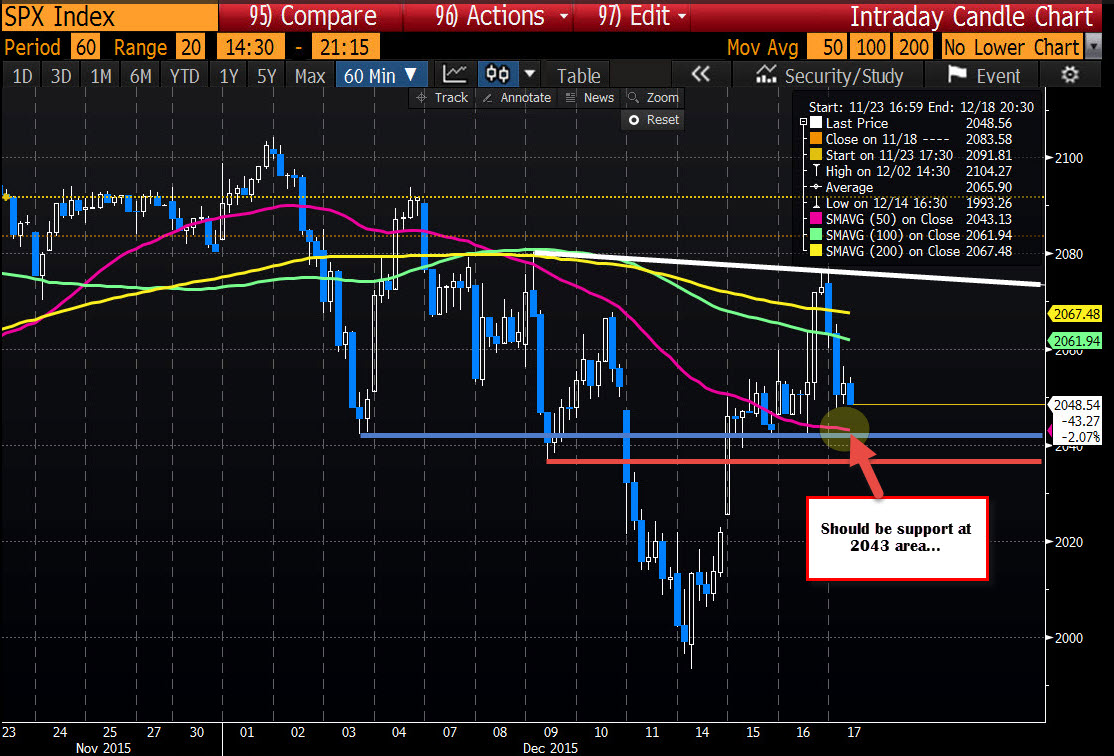
Looking at the hourly chart, it may be looking to form a reverse head and shoulders. That may find support at the 2043 area. If so and we get a break of the neckline above, the market might get a year end rally. A move below 2036 and then the 100 day MA at 2029 and once again, the market will look sick.

On again. Off again, I know, but such is the market action.