
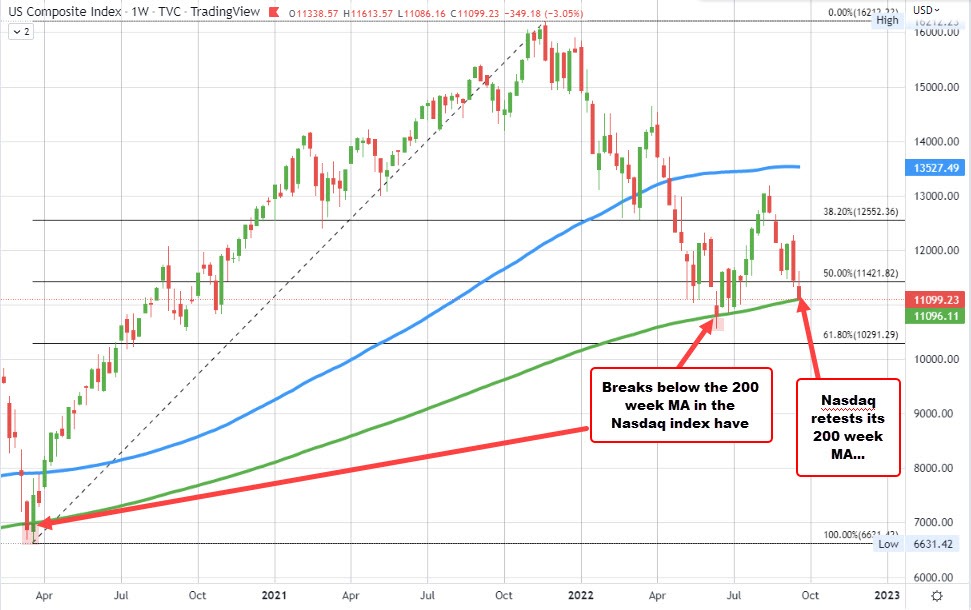
The NASDAQ index is trading down -105 points at -0.92% at 11114 .67. The low for the day reached 11086.16. That took the price to the lowest level since July 14. It also took the price briefly below its 200 week moving average currently at 11096.20 (see green line in the chart above).
The last time the price traded below its 200 week moving average was back on June 13. That was the day that the NASDAQ index bottomed at 10565.14.
You have to go back to the weeks of March 16 and March 23 of 2020, to find the previous dips below the 200 week moving average. At that time the price closed below the moving average on March 16, but rebounded and closed higher the following week (March 23 week). That failure started the bull move that culminated in the price peaking at the end of 2021 at 16212.23.
From the peak to the the current level, the decline has erased -31.62% off the NASDAQ index.
Needless to say the 200 week moving average is a key support level . Move below is more bearish but recent history has also said that the declines below the 200 week moving average are limited. The only way to find that out is if the price breaks and then fails. If it breaks, however, the sellers are still in control and the bias is to the downside.
The move to the downside is been helped by continued rise in US yields. The 10 year yield is now pushing 3.7%. That's up 18.8 basis points on the day.
UPDATE. The price in the last few minutes has moved to a new session low at 11082.68. That puts the price back below its 200 week moving average. Sellers bearish bias increases. The buyers need to push the price back above the moving average and stay above that level to get out of this hole.

