The Nasdaq is leading the way to the downside for the second consecutive day. The price is currently down -141 points or -1.25% at 11098.98. The low price reached 11068 .65
Yesterday, the price high found willing sellers against the 50% midpoint of the move up from the post Covid lockdown low from 2020 to the high reached at the end of 2021 (November 2021). The midpoint level comes in at 11421.82. The high price yesterday reached 11425 just above that midpoint level, before rotating back to the downside. Also in play on the weekly chart is the 200 week moving average (green line in the chart above) currently at 11312.91.
Admittedly, the price has been trading above and below that 200 week moving average over the last few months. Last week the price close back above it, and also above the aforementioned 50% retracement level. However sellers this week have reversed that bias shift back to the downside. The 200 week moving average comes in at 11312.55. The price is well below that level at 11097 currently. It would take a move back above the 200 week moving average to give the buyers some comfort.
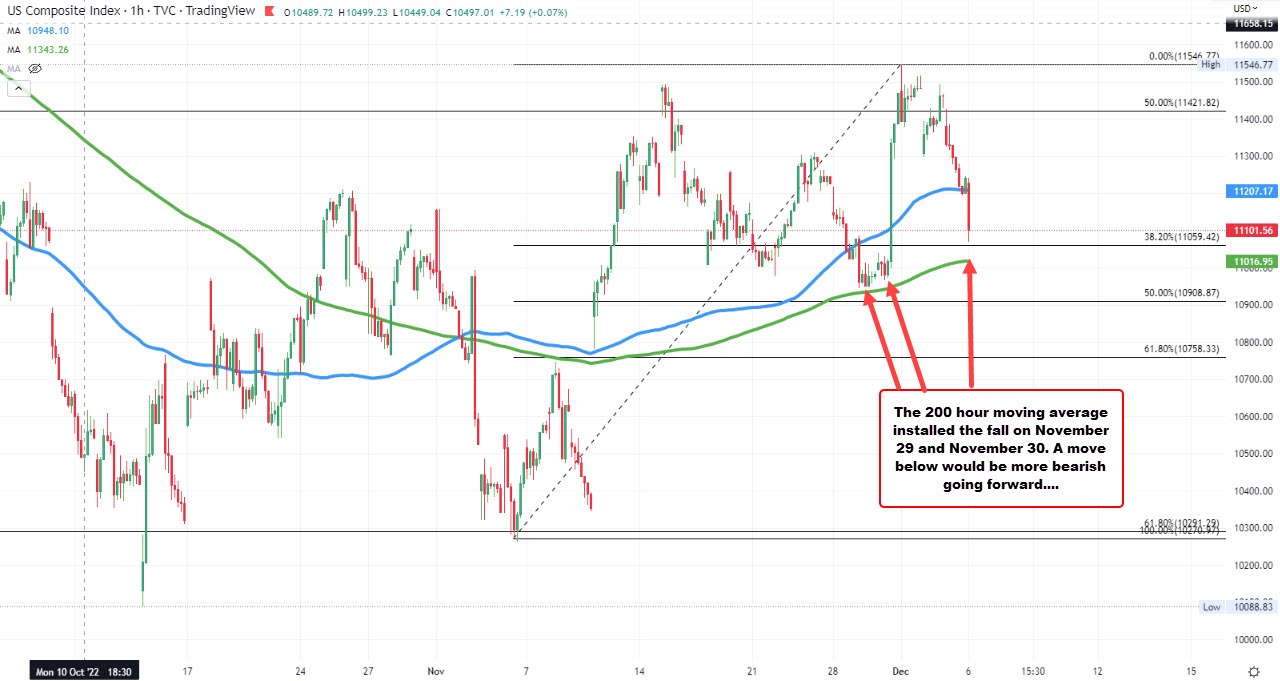
Drilling down to the hourly chart, the 38.2% retracement of the move up from the November 4 low comes in at 11059.42. That is the next downside target followed by the rising 200 hour moving average at 11016.97 (green line in the chart below). Back on November 29 and November 30, the price approached that moving average only to find buyers leaning against the level. The price rebounded.
A break below going forward would increase the bearish bias. Be aware.