
The S&P index is trading nearer the low for the day and currently near unchanged on the day. The high for the day took the index up 33.34 points. The low took the index down -10.57 points. The current price is at 3945.85 that is down -0.70 points or -0.02%.
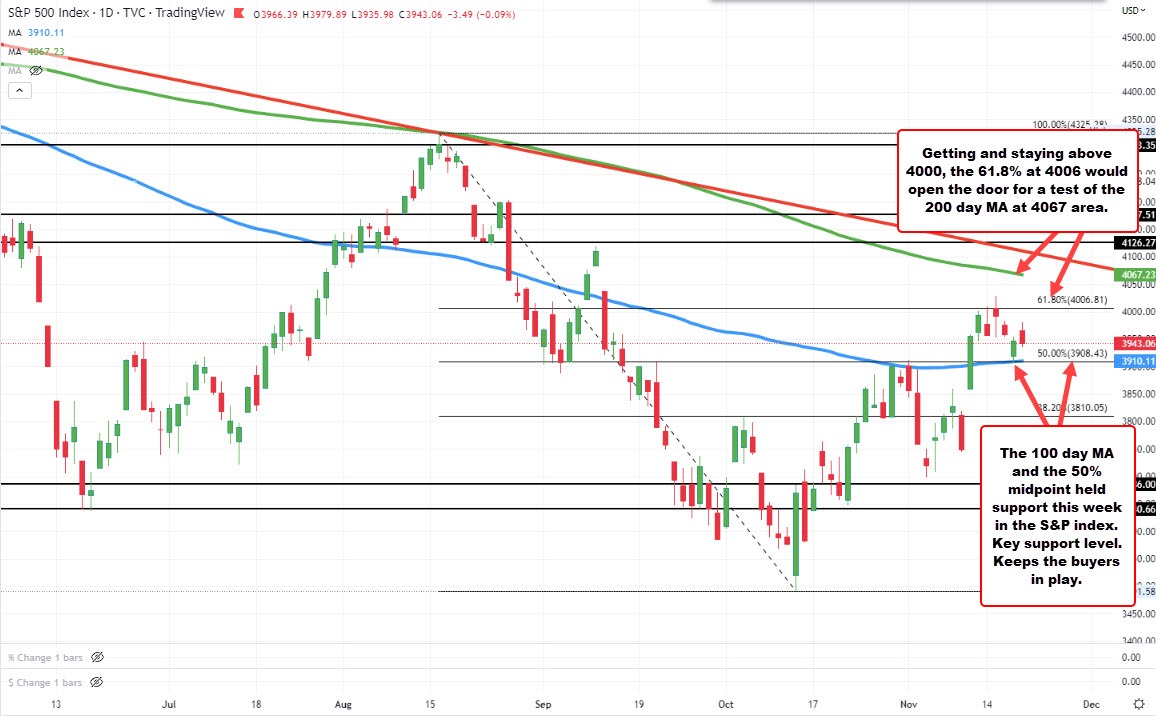
Looking at the daily chart, the low price reached 3906.54 on Thursday and at the low the index tested the 100 day MA at 3908.80. The 50% of the move down from the August high was also in the area at 3908.40.
Buyers stalled the fall. Holding that MA and midpoint level gives the buyers hope. It also increases the 100 day MA/midpoint levels importance going forward. Stay above is more bullish. Move below and the technical picture deteriorates.
Staying on the day chart, the 61.8% of the move down from the August high is at 4006.81 just above the natural resistance at 4000. The high earlier this week reached above both those levels reaching a high of 4028.84 on Tuesday before rotating back to the downside. Getting above the 4000 area, and stay above would have traders looking toward the 200 day MA which is at 4067.22 and moving lower. Recall back in August, the high stalled near that MA and started the run to the low for the year.
So if there is a theme this week, it is that the selling weathered the storm at the 100 day MA/50% retracement support. That is good news for the index as long as the technical levels can continue to hold.
For the week... the index is trading down -1.25%. At the high, the index was up 35.92 points from last Friday's close. At the low, the index was down -86.38 points. The current price is down around 50 points.
/inflation

