
The major US indices are trading at new session highs. The Dow industrial average is up 579 points or 1.99%. The S&P index is up 75.7 points or 2.08%. The NASDAQ index is up 225 points or 2.08% as well.
Him him him
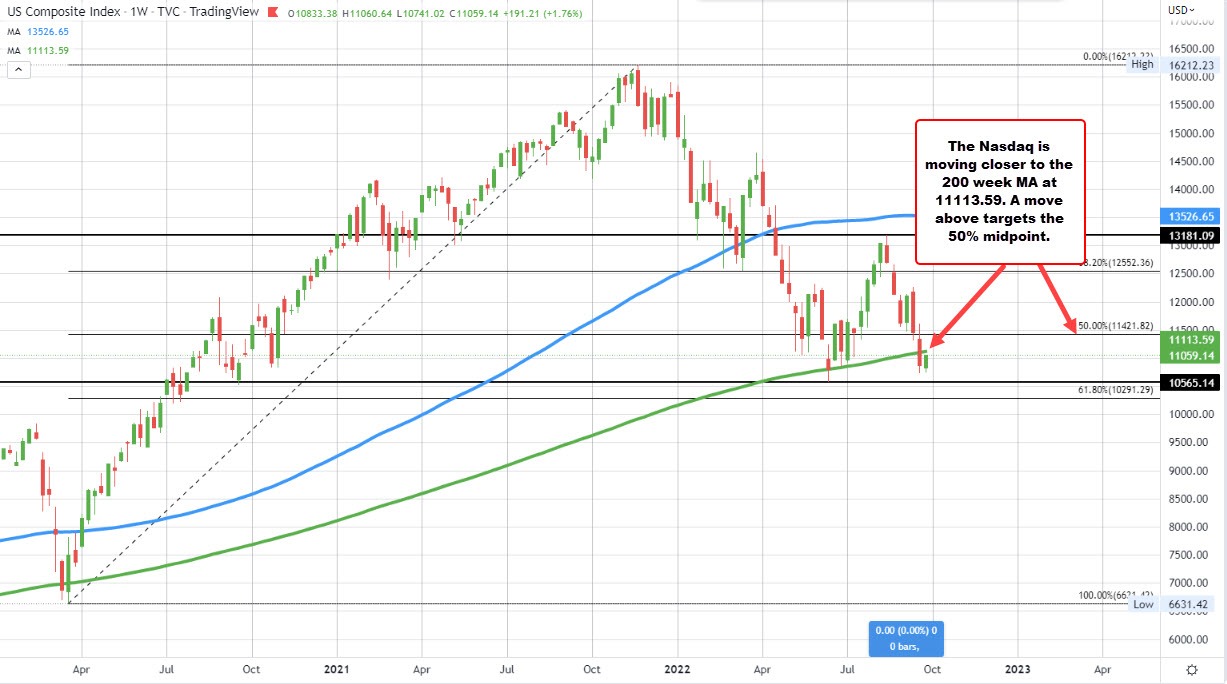
Looking at the NASDAQ on the weekly chart the 200 week moving average comes in at 11113.59. The high price just reached 11060.64.
That 200 week moving average will be a key topside target that traders will be eyeing as the market moves toward the close for the week on Friday.
Last week was the 1st close below that moving average since March 2020. A failure on the break lower would give buyers some added confidence for a further technical bounce with the 50% midpoint of the move up from the March 2020 low coming in at 11421.82 as the next key target.
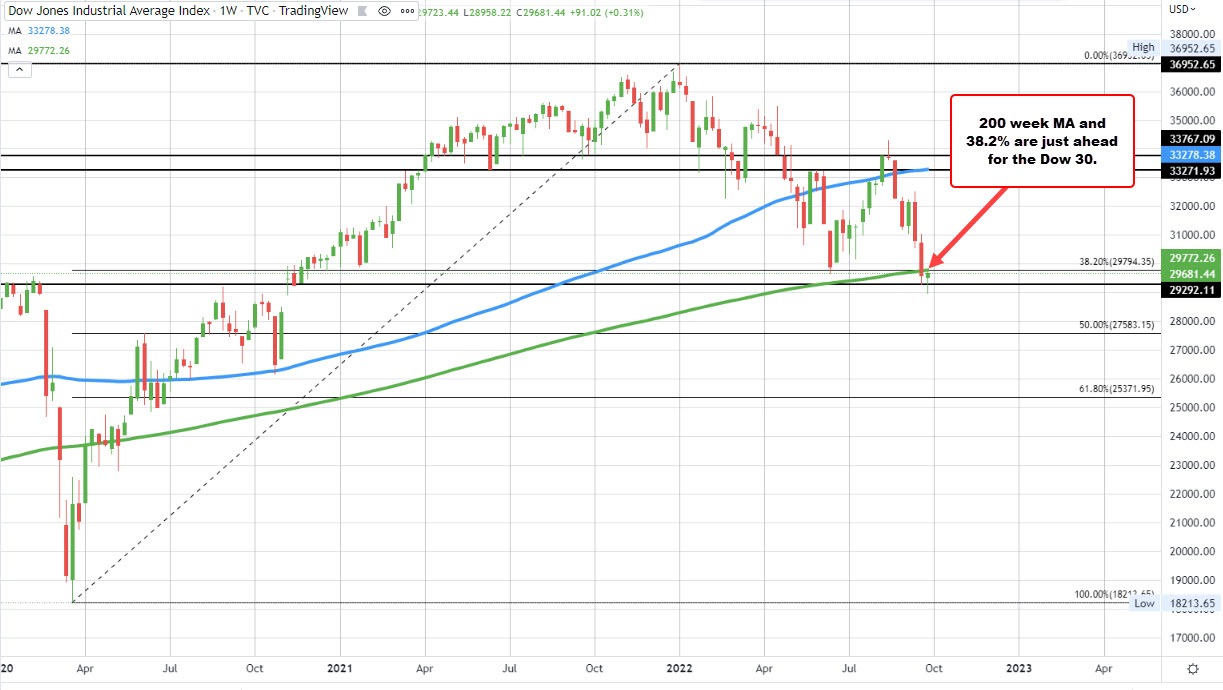
Looking at the Dow 30 index, its 200 week MA is at 29772.31. The high price reached 29723.44. Like the NASDAQ index, a move and close above the 200 week moving average this week would be more bullish as traders would be disappointed of the failed break last week.
To have 2% gains is a breathe of fresh air. However, the buyers are not out of the woods. There are still a lot of potential headwinds as the US is still near highs, rates are still high and could impact growth. Earnings should still be under pressure and that could still make the bounces shallow and met by selling, vs. follow through buying. I will be watching the charts and technicals for clues.

