The USDCAD has extended further to the upside and in the process has seen the price move above - and away - from the 50% midpoint of the move down from the pandemic high to the 2021 low. That midpoint level comes in at 1.33364. The current price trades at 1.3392. The high price today has extended to 1.3405 so far.
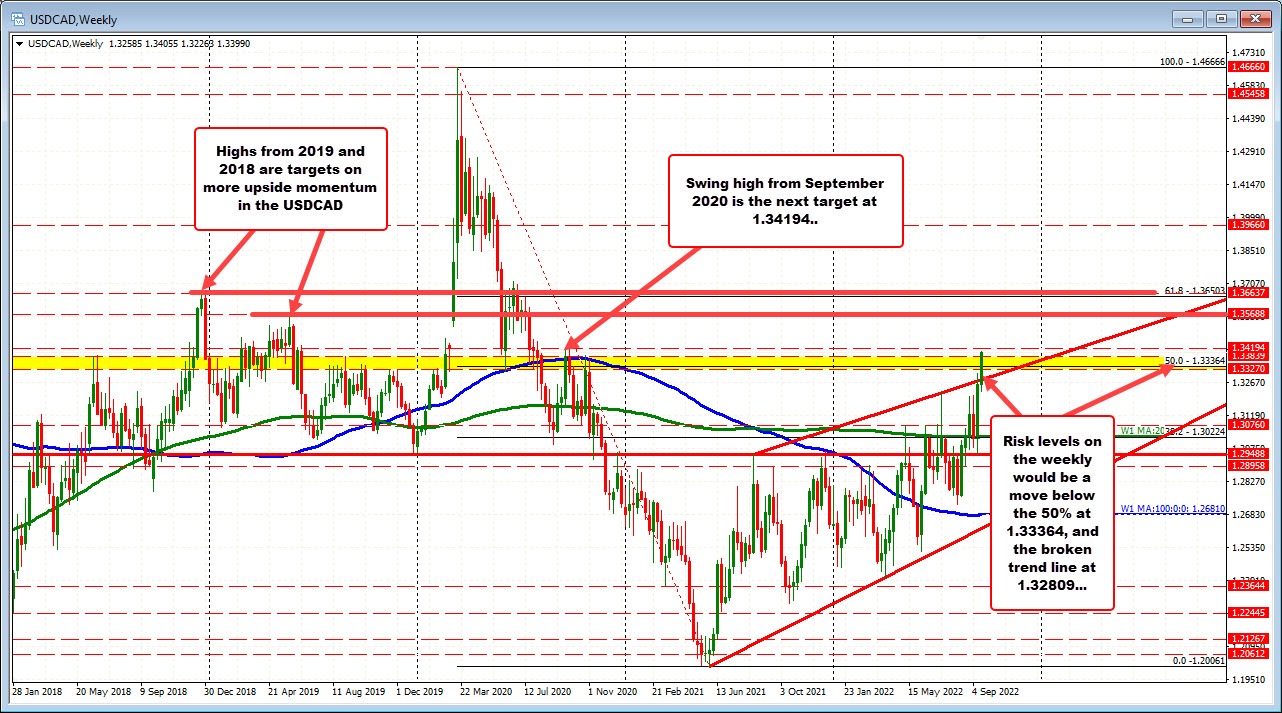
Looking at the weekly chart above, the price today also extended above a swing area between 1.3327 and 1.33839. Bullish.
The next key target comes in at 1.34194. That level corresponds with the swing high going back to September 2020. Move above that level opens the door for further upside momentum with 1.35688 (swing high for 2019) as the next key target followed by the 61.8% retracement, and the high price from 2018 near 1.36503.
What would ruin the bullish bias?
Move back below the 50% retracement 1.33364, and the low of the swing area at 1.3327 will be step number 1. The next step would be to move back below the broken trend line on the weekly chart at 1.32809.
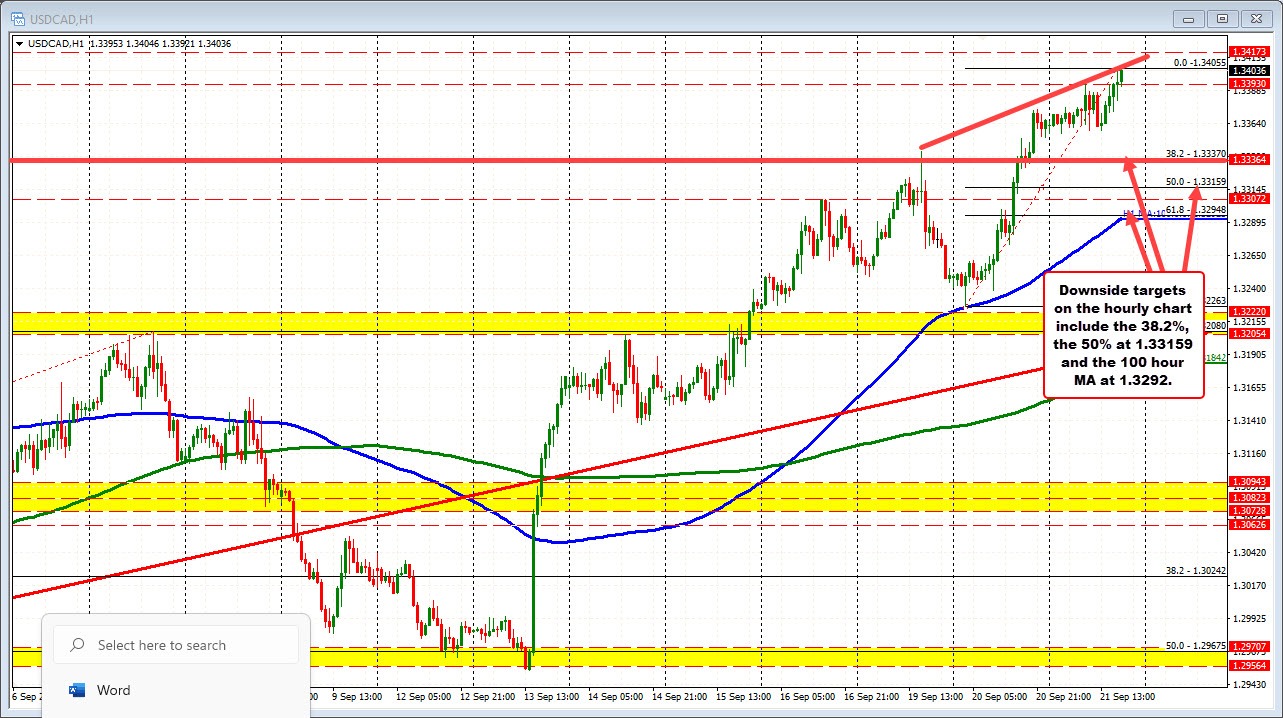
Drilling to the hourly chart, the pair is putting distance between the 100 hour MA below currently at 1.32923 and the current price at 1.3400
Just yesterday, the corrective move to the downside stalled at the 100 hour MA and bounced higher.
The pair is currently testing a topside trend line that if broken, increases the bullish bias. Stay below and there may be some downside rotation into the fed decision.
The move higher over the last two days has the 38.2% of the move up at 1.3337 which is also the 50% on the weekly chart. Having both those retracement levels (one on the hourly and one on the weekly) increases the levels importance through the FOMC decision Be aware. Other support comes in at the 50% on the hourly at 1.33159 and the rising 100 hour MA at 1.3292.