
Gold is a timeless, resilient precious metal boasting a rich and colourful history, one that societies have coveted for centuries. Primarily mined using underground tunnels or open pits, China remains the leading gold producer in the world, closely followed by Russia and Australia. Given its value and finite nature, gold remains among the most popular commodities traded globally.
Investing in gold, or the ‘yellow metal’, can be achieved in several ways and across different markets, including owning and storing physical gold bullion, investing in gold Exchange-Traded Funds (ETFs) that are either physically backed or synthetic, futures or options contracts (leveraged derivative markets), as well as through Contract for Differences (CFDs), which also serve as leveraged derivative products.
The official unit of measure for gold is a troy ounce, where one troy ounce equals 31.10 grams. Although you may hear (and read) traders referring to gold as measured per ounce, an ounce is technically lighter at 28.35 grams.
From retail traders to hedge funds and major central banks, gold is a non-yielding investment that remains a widely traded liquid asset used for speculation and hedging. Given its long history as a store of value, investors often look to gold’s safe-haven appeal in times of unrest and as a hedge against inflation. Whether you’re an experienced investor or just beginning your journey, this article will help unwrap the forces that have shaped gold’s history and what the future may hold for the precious metal.
Gold’s Performance: A Rich and Colourful History
Historically, gold (XAU) has exhibited significant price movement versus the US dollar (USD).
Until the abandonment of the ‘Gold Standard’ in mid-1971 – a point in history when US President Richard Nixon announced that the US would no longer convert USD for gold – the price movement of gold was fixed at around $35 per troy ounce. Following the removal of fixed prices, this ushered in an era of floating exchange rates and left gold susceptible to market forces, such as Inflation, monetary policy, and economic instability.
· 1976-1980: The price of gold bottomed at $100 and rallied strongly to reach a record high of $873 in early 1980. The oil crises in the 1970s, coupled with stagflation, were major catalysts behind the advance in gold.
· 1980s-1990s: Gold prices declined and largely consolidated between $300 and $500 amid elevated interest rates and global stability. Heading into 2000, gold fell to lows south of $300 due to central banks reducing reserves.
· 2003-2005: Safe-haven gold buying took hold at the beginning of the Iraq war, reaching highs beyond $400.00.
· 2005-2006: Gold prices reached highs north of $500, followed by a rally to $700 amid softer demand for the USD and geopolitical concerns.
· 2007-2011: The beginning of another strong leg higher was seen, one that, aside from a correction in 2008, rallied to a record high of $1,920. Several factors triggered the rally, including safe-haven buying amid the global financial crisis, weakening USD, rising commodity prices, geopolitical concerns, and inflationary pressures.
· 2012-2015: Gold fared poorly between 2012 and 2015, dropping to lows of $1,046 in late 2015. This was due to increased demand for the USD, quantitative easing from the US Federal Reserve (the Fed), a slowdown in central bank buying, weak investment demand, and profit-taking.
· 2016-2020: Following the sizeable decline between 2012 and 2015, 2016 witnessed a turnaround in gold’s fortunes. The COVID-19 pandemic also saw gold catch a strong bid in 2020 as the global economy came to a standstill amid lockdowns and global uncertainties. Gold soared 27% from $1,517 in January 2020 to more than $2,000 by the summer of 2020, another fresh record high for the yellow metal.
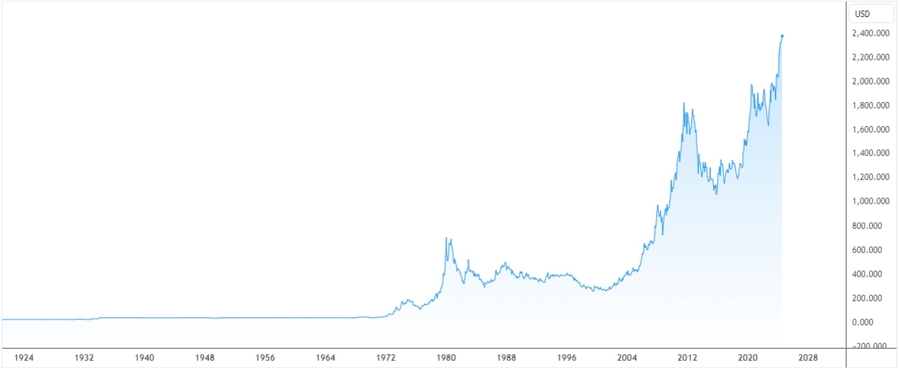
· 2020-2024: After the price of gold topped out at $2,075 in the summer of 2020, it subsequently consolidated between the said highs and lows of around $1,680 until breaking out higher in early 2024. Mid-July saw gold reach a new all-time high of $2,483 amid strong global demand.
Historical price chart of spot gold (XAU/USD) over the last 100 years:
Gold in 2024?
Versus the USD, the spot price of gold recently refreshed all-time highs at $2,483 and has rallied nearly +20% year to date, following a +13% gain in 2023. The rise in gold has been quite surprising, particularly given the disconnection from real US yields. On average, gold and real US yields were inversely correlated markets, but since early 2023, the correlation has turned positive.
As highlighted, the Fed is expected to begin reducing the rate on its target range. Coupled with geopolitical tensions, persistent (sticky) inflation, inflation hedging, and central bank purchases, where does this leave the price of gold this year and in the future?
Below are five views from various key market participants:
World Gold Council:
‘For gold, we believe the catalyst could come from falling rates in developed markets, that attract Western investment flows, as well as continued support from global investors looking to hedge bubbling risks amid a complacent equity market and persistent geopolitical tensions. Gold’s outlook is, of course, not without risks. A sizable drop in central bank demand or widespread profit-taking from Asian investors could curtail its performance. As it stands, however, global investors continue to benefit from gold’s role in robust asset allocation strategies’.
JP Morgan:
‘Many of the structural bullish drivers of a real asset like gold – including US fiscal deficit concerns, central bank reserve diversification into gold, inflationary hedging and a fraying geopolitical landscape – have lifted prices to new all-time highs this year despite a stronger US dollar and higher US yields, will likely remain in place regardless of the US election outcome this autumn’.
VanEck:
‘Looking forward, gold is well positioned to continue its rally, especially if Western investors begin to return to the market. The anticipation of rate cuts by the Federal Reserve, along with continued inflationary pressures and geopolitical risks, are likely to further bolster gold's appeal as a hedge against market volatility. With this backdrop, we believe that gold prices could reach their inflation-adjusted highs of $2,800 per ounce in the near term’.
ING:
‘We believe gold is poised to keep its positive momentum going in the second half amid the current global geopolitical and macroeconomic landscape while central bank demand is expected to grow’.
DDQ Invest:
‘The anticipation of rate cuts by the Federal Reserve, along with continued inflationary pressures and geopolitical risks, are likely to further bolster gold’s appeal as a hedge against market volatility. With this backdrop, we believe that gold prices could reach their inflation-adjusted highs of $2,800 per ounce in the near term’.
Conclusion
Gold’s history shows that, despite sizeable corrections between 1980 and 2000, from 2011 to 2015 as well as from 2020 to 2022, price rallied from $35 to current all-time highs of $2,483. According to Statista, ‘between January 1971 and March 2024, gold had average annual returns of 7.98%, which was only slightly behind the return of commodities, with an annual average of 8.0%’.
Many desks agree that there is room for further outperformance in gold this year, with trend-following strategies likely to continue buying dips.

