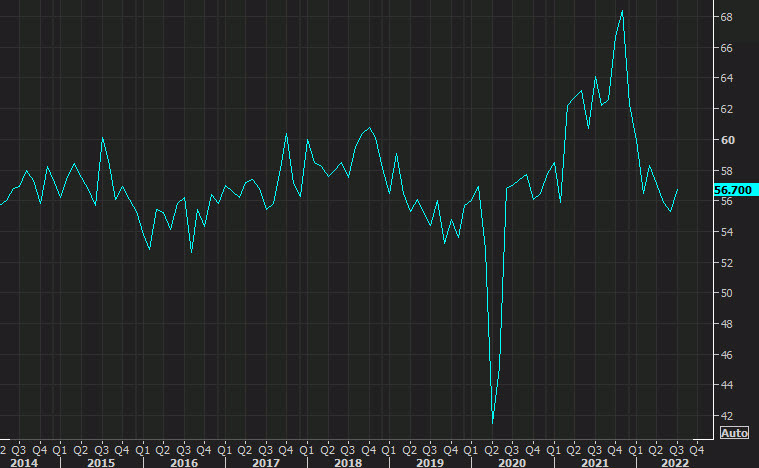
- Prior was 56.7
Details:
- Business activity 60.9 vs 57.0 expected (prior 59.9)
- Prices paid 71.5 vs. 72.3 last month
- Employment 50.2 vs. 49.1 last month
- New orders 61.8 vs. 59.9 last month
- Supplier deliveries 54.5 vs. 57.8 last month
- Inventories 46.2 vs. 45.0 last month
- Backlog of orders 53.9 vs. 58.3 last month
- Exports 61.9 vs. 59.5 last month
- Imports 48.2 vs. 48.0 last month
The S&P Global services PMI plunged in July and August so a divergence is brewing in two surveys that should be tightly correlated. Depending if you're a bull or a a bear, pick your survey. One shows a healthy services sector, the other shows a crash.
This is certainly the more-established survey and it's pushed back up Fed hike odds for 75 bps and the US dollar.
Comments in the report:
- “Starting to see some cost pressures relief; the overall supply environment is healthy.” [Accommodation & Food Services]
- “Some pullback on projects by clients, but activity is still strong for our company. This has alleviated some labor availability issues. Generally, there has been improvement in lead times and prices, but still longer and higher, respectively, than in 2021.” [Construction]
- “Supply chain issues continue to significantly extend lead times, with a shortage of materials to build scientific equipment and machinery contributing to the issue. Purchases need to be made three to six months in advance, in addition to the normal lead time. As for the higher education industry, it is breaking records for student applicants.” [Educational Services]
- “The supply chain and labor continue to be significant issues. Repair parts are nonexistent. Lead times for durable goods are extended, and the less-expensive, mass-produced products are breaking at increased rates — no QC (quality control). The FDA (U.S. Food and Drug Administration) must be reeling because we have been reporting sometimes daily. I’m concerned that a certain percentage of faulty products are probably discarded, which adds to the cost of doing business. Surgery and other hospital products cannot be culled, so it’s a complete loss — if they are red-bagged, that is another cost.” [Health Care & Social Assistance]
- “The supply chain challenges affect a portion of our buys as they include products and components made outside of the U.S. that are subject to shipping delays and other issues.” [Management of Companies & Support Services]
- “COVID-19 still affecting many businesses. Also, there is a labor shortage.” [Professional, Scientific & Technical Services]
- “Lingering concerns about inflation and price increases. Still having difficulties hiring staff to fill many positions.” [Public Administration]
- “No major changes. Concerns about the macroeconomic climate and consumer confidence.” [Retail Trade]
- “Very long lead times from major equipment — Original Equipment Manufacturers (OEMs). Commodity price escalation appears to be leveling.” [Utilities]
- “Business is pretty steady month to month, but we expect seasonal supply increase by September that will moderate prices.” [Wholesale Trade]
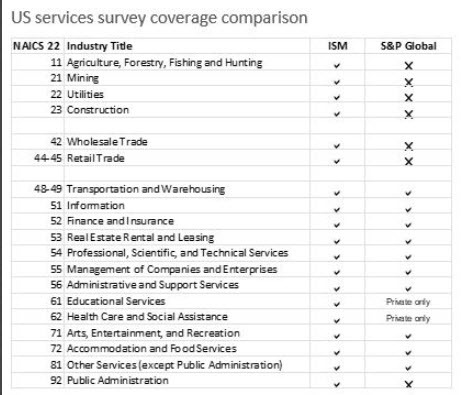
Asked about the divergence, Chris Williamson from S&P Global highlighted public admin and utilities in the ISM survey as a potential reason.
Here's a survey comparison.