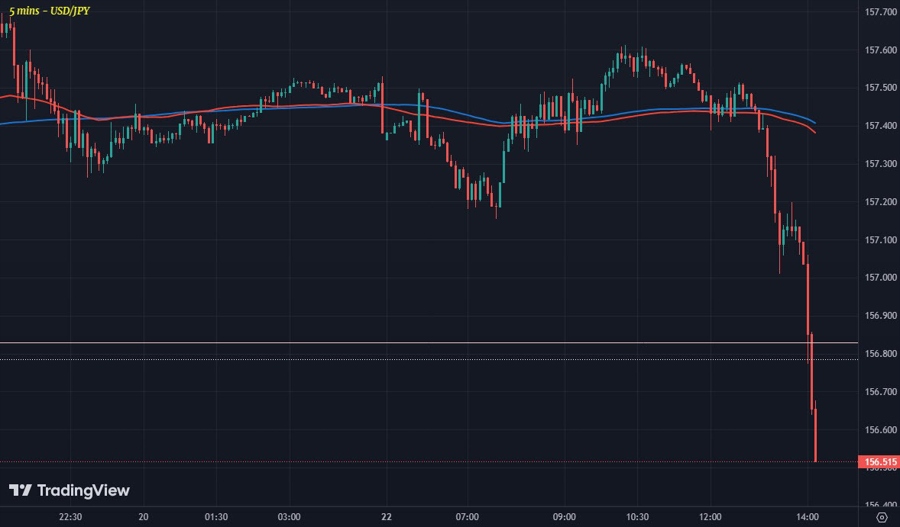
USD/JPY 5-minute chart
The pair had been holding steadier around 157.30-50 levels in Asia before easing slightly to 157.00 just about a half hour ago. The break under the figure level seems to be triggering some stops amid a quick fall to 156.50 on the day.
This cuts back some of the bounce last Thursday, with the pair having hit a low of 155.36 at the time. This suggests that sellers are also still interested, with dip buyers struggling to gain too much traction after Japan intervened. Here's a look at the daily chart:
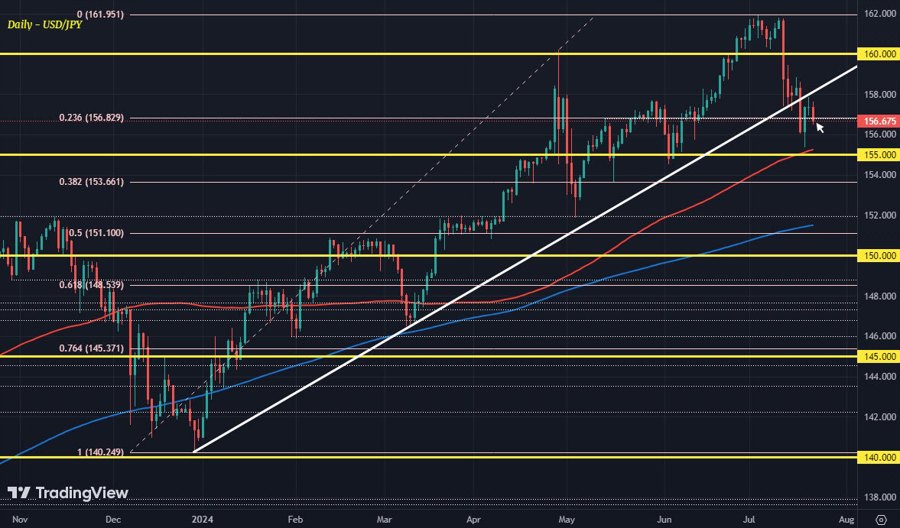
USD/JPY daily chart
The broken trendline support now acts as somewhat of a resistance for buyers in the latest rebound last week.

