Buyers struggling but $13465 floor needs to be busted
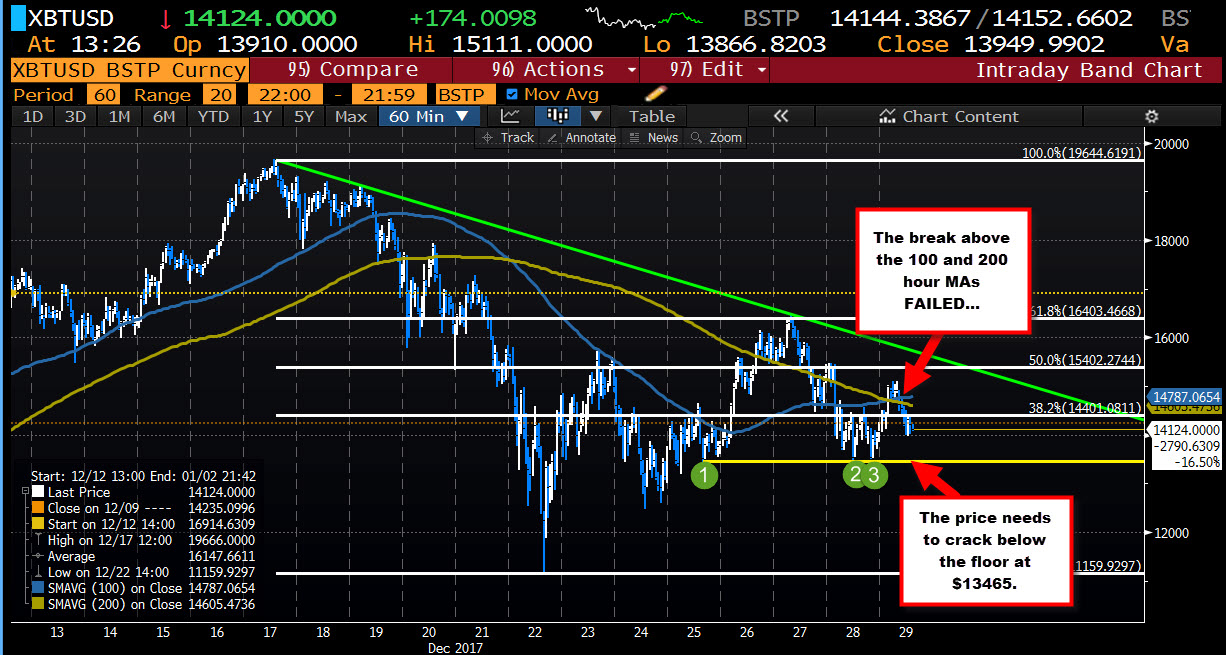
The price of bitcoin fell below the 200 and 100 hour MAs yesterday and stayed below those MAs. Bearish. However, on the downside, the $13465 area stalled the downside on 3 separate occasions going back to December 25th (two tests yesterday). So, buyers below ran into sellers above.

Today, the Asian push was to the upside. The price moved above the two moving averages (blue and green lines in the chart above), but failed to keep the buying momentum going. Buyers stood aside, and the price rotated back below the two MAs at $14605.47 (for the 200 hour MA) and $14787.06 (for the 100 hour MA). Stay below those levels is more bearish.
Like yesterday, however, if there is to be more liquidation (from the longs - remember bitcoin is about being long or square) from the buyers, a move below the $13465 floor will be eyed. A break below is needed to keep the pressure on the buyers out there.
We currently trade at around $14124 (as I started the post) on the Bitstamp exchange - about in the middle of the MA/floor range. So price action can go either way. However, the buyers did have their shot. Is it the sellers turn to see if they can scare the longs into more liquidation? They have the edge for now.
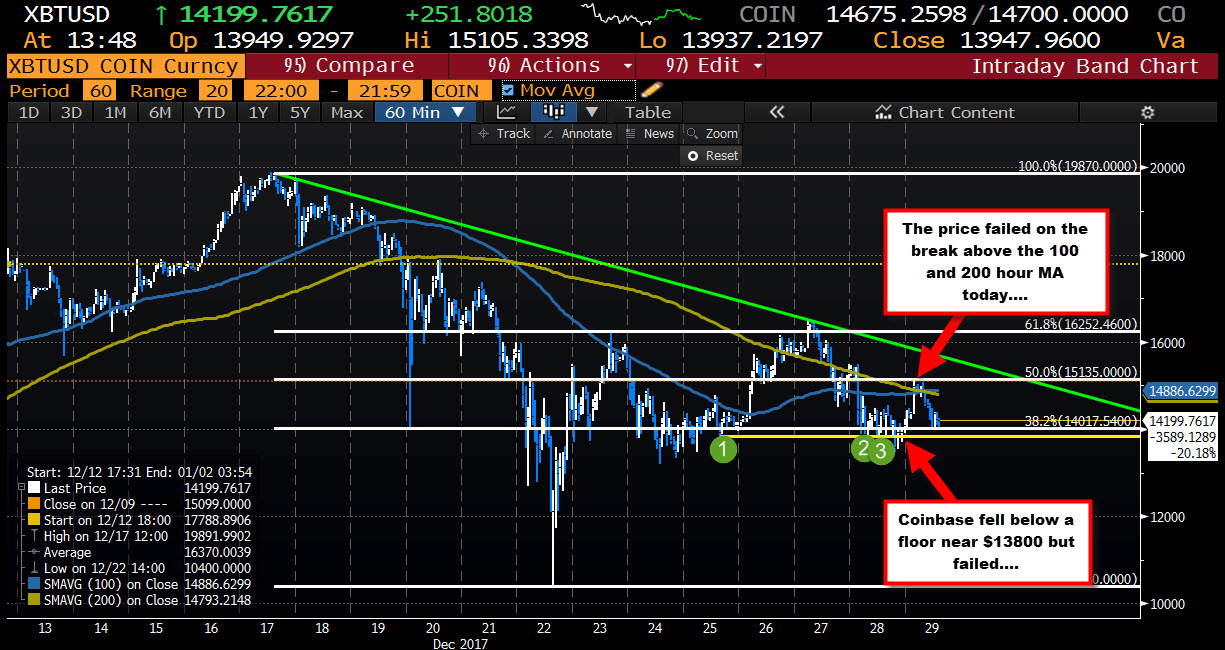
Note: the prices outlined are using the price feed from Bitstamp. The chart on the Coinbase exchange shows a similar picture but has some differences. For it, the floor comes in at $13800 and was broken in trading yesterday but failed (see chart below). ON the topside today, the 100 and 200 hour MAs were broken but failed (like the Bitstamp chart). I would expect selling to intensify on a break of $13800.
