Above 50% of 5 month range and 100 and 200 day MA
The FOMC decision is approaching and the EURUSD if anything has a touch more bullish bias

.
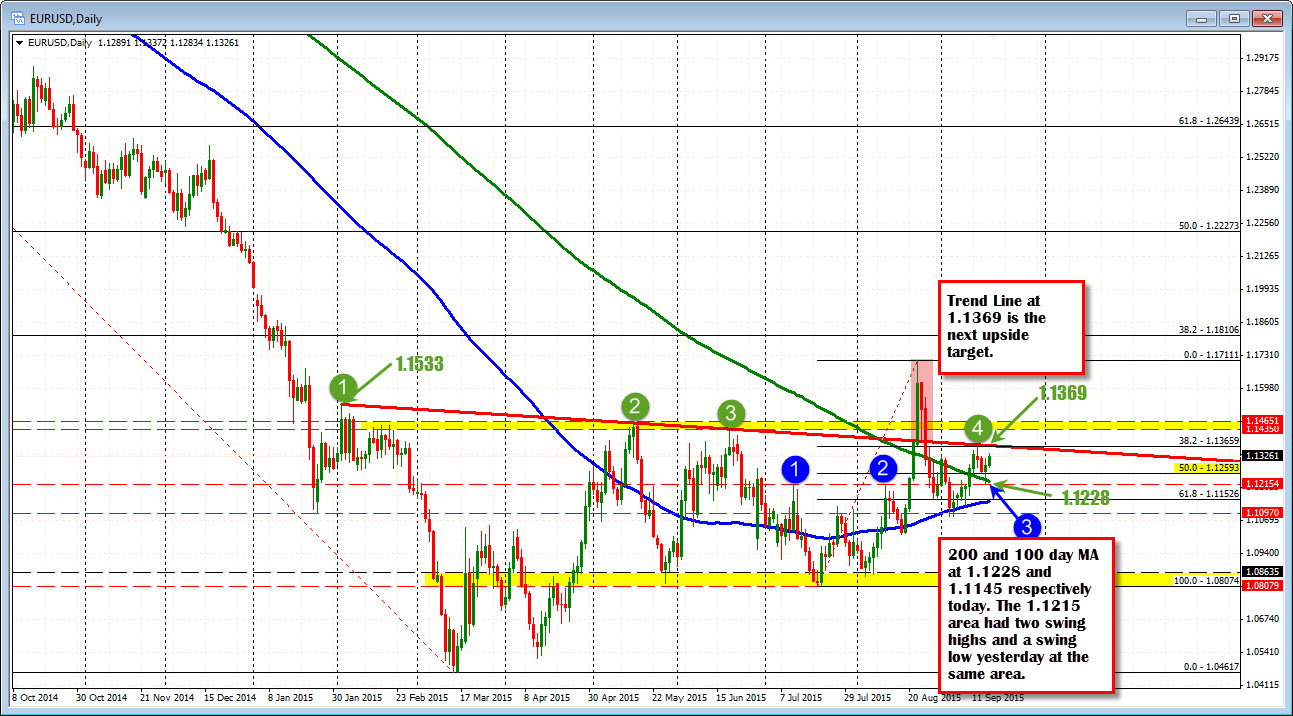
Looking at the daily chart above, the pair in September bottomed close to the 100 day MA (blue line in the chart above at 1.1145 currently) and also moved above the 200 day MA (currently at the 1.1228 level - green line in the chart above). The price has now closed above the 200 day MA for the last 5 days although the price action has been up and down.
Yesterday, the price did dip below the 200 day MA to a low price of 1.1213. That low was very close to the highs in July (1.1215) and the August 12th swing high at 1.1213 as well -increasing that levels importance through the FOMC decision. So buyers showed up against that area at the lows this week.
The price is also trading above the 50% of the 5 month trading range at the 1.12593 level.
ON the topside, The topside trend line comes in at 1.1369. Yes, the price did spike above that line on the Dow down 1000 point day (stops and massive buying), but pushed back below it two days later. On Monday, the price tested that line (green circle 4) and rotated lower. Pay attention to it for bullish clues. Get above and stay above is important..
Above that the 1.1435-55 were swing highs going back to Feb. (May and June highs were in that area - yellw area above). This will be another target on further upside momentum today (through the FOMC)
With the price below the topside trend line at 1.1369 and above the 50% at 1.1259 and 200 day MA at 1.1228, (current price at 1.1325ish), the market has positioned itself with a little more bullish bias, but below some topside resistance as well. Risk is at high levels of course as the Fed flips a coin. I would expect that the price remains contained and then makes a run at 2 PM ET.
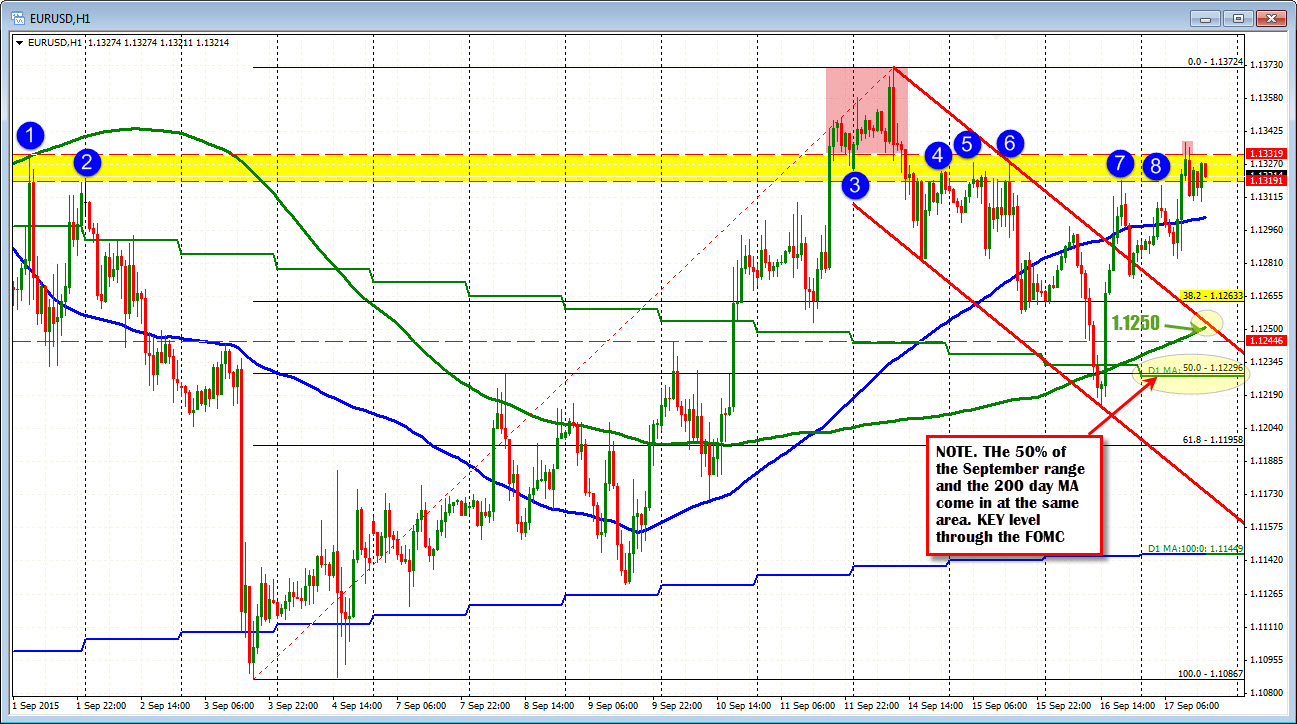
Any key levels to eye on the hourly? Looking at the hourly chart belwo, the pair has traded above and below the 100 hour MA over the last 24 hours (blue line in the chart below). The 1.1319 -32 area has a number of swing highs going back to Sept 1 (see blue circles). We moved above that area on Friday/Monday but has spent most of the week below that area (see red area in chart below). The 38.2% of the Sept range is at 1.12633. The 200 hour MA (green line in the chart below) comes in at 1.1250. The 50% of the September range and the 200 day MA both come in at 1.12295 area which makes that price level a key level on the downside through the FOMC.
