Peaks against the 100 hour MA
The EURUSD moved higher over the last hour or so, and in the process moved above the 38.2% at 1.19258. The break, led to a run higher. That run peaked against the 100 hour MA (blue line in the chart below) and 1.19549 (the high reached 1.19534). That moving average was the highest of three including the 100 hour moving average on the 4-hour chart at 1.19393, and the 200 hour moving average at 1.19462 (the 100 hour MA at 1.19544 was the highest). Although the high peaked right against the highest MA (a move above might have triggered stops), the sellers did lean, and the price has rotated lower (see earlier post here).

Going forward, traders will want to see that moving average area hold resistance (yellow area). That is risk for shorts.
Better yet, the shorts/Bears would like to see a resumption of the move lower, now that resistance was successfully tested (and held).
A move below the 1.19258 and then 1.1910-15 will be close levels to get below. Ultimately, a move below the 1.1876 and the 200 bar MA on the 4-hour chart at 1.18688 will be more important breaks.
The pair has been trading up and down since August 28th. The range over that time has been between 1.18225 and 1.20969. The low this month stalled at 1.18371. Those low levels (at 1.18371 and 1.18225) are other key levels to break if the bears are to make more of a play.
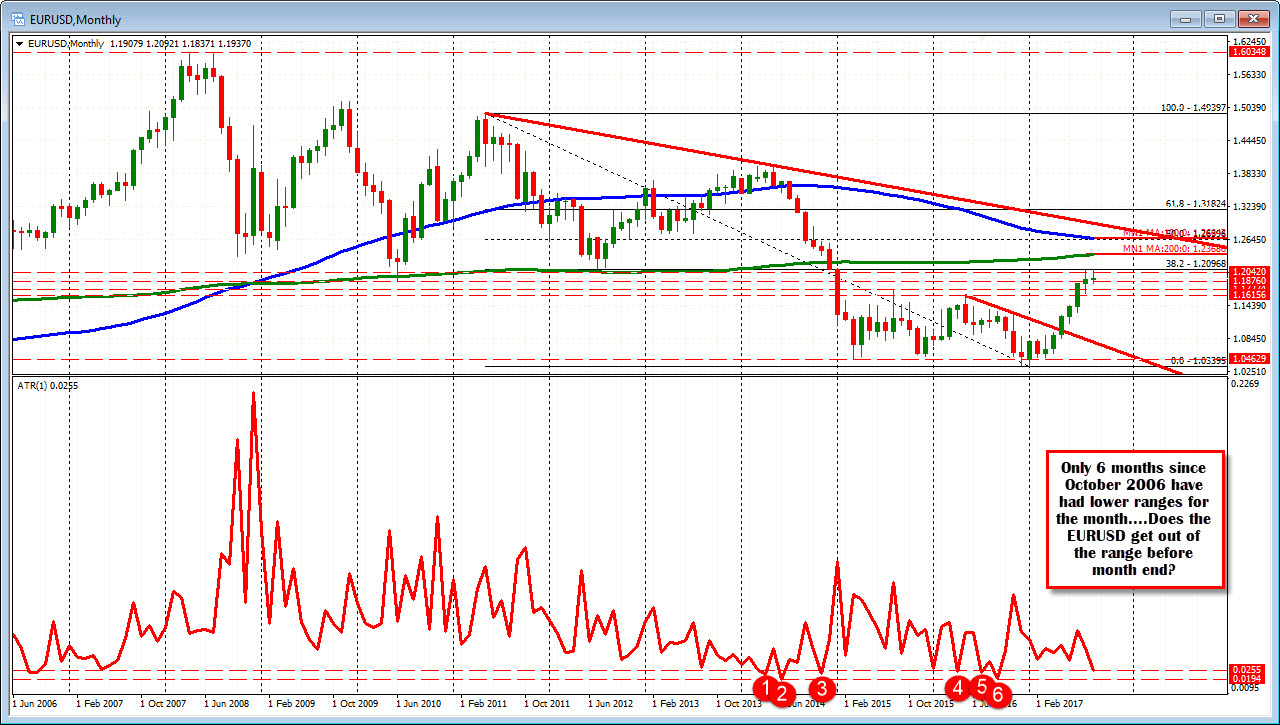
PS. The range for the month is the the 7th lowest low to high trading range going back to October 2006. Is that narrow range extended before month end?
