What are the charts saying....
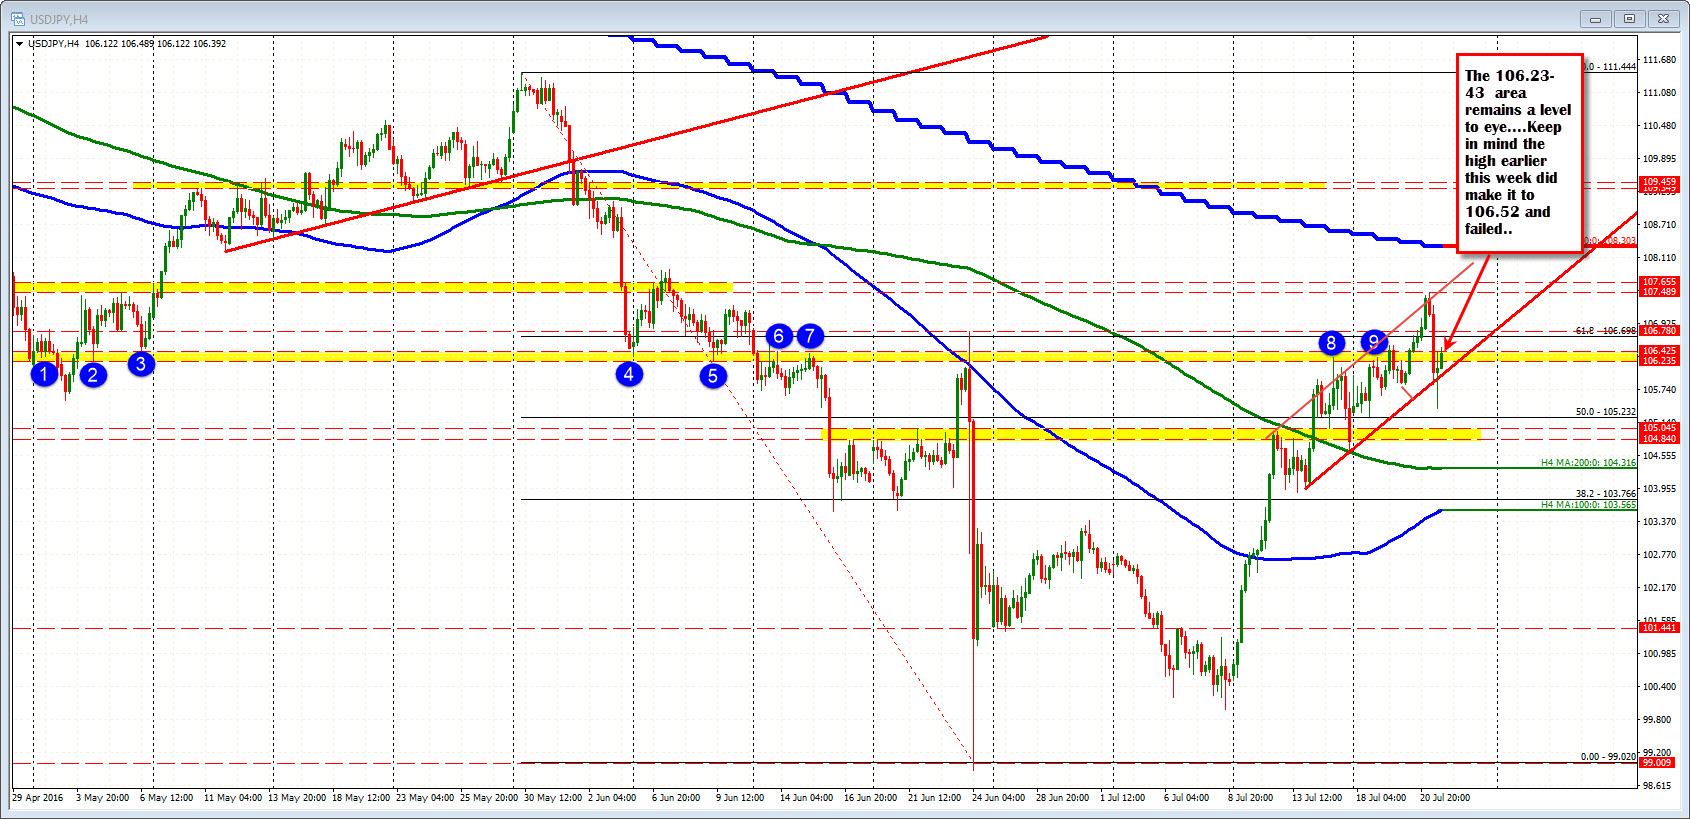
I have outlined the 106.23-43 as a topside area to get above. With the high from Tuesday that extended to 106.52 that might be extended a bit. Anyway, the 106.23-43 was an area going back in time where there were a number of swing highs and lows (see blue circles in the chart below). We currently trade in that range and have traded above and below it in trading today.

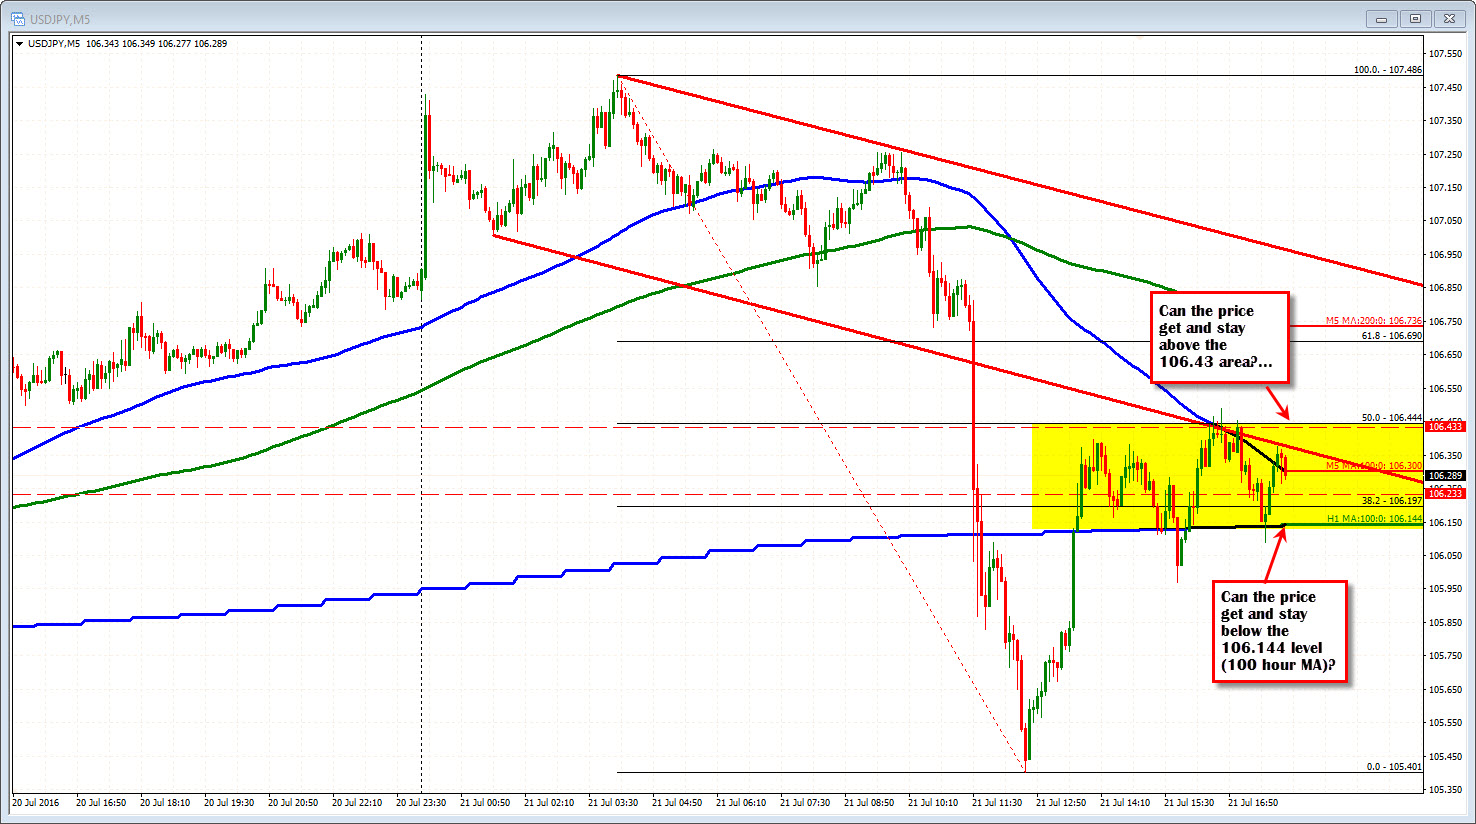
Drilling down and looking at the 5 minute chart for trader clues and adding a 100 hour MA overlay on the chart, the 50% of the days range is a pip away from the 106.43 level. In the NY session, the price has created a lid near that level. The high did have an extension to 106.49 but you can see the sellers against that ceiling. What about the 106.23 level? Well the price has spent more time below that level and even moved below the 100 hour MA but failed on both attempts (at 106.144 currently). So there is a battle going on and we currently sit in the middle (yellow area).
My guess is the clues will come from the price action in this range and on the breaks outside. Sometimes you simply have to wait things out.
