The index has moved up and down over the last 5 days, but....
The Nasdaq index has moved up and down over the last 5 trading days (see the hourly chart below). So neither the buyers or the sellers are really taking charge at these levels.
However, there is one thing that is concerning for the bulls.
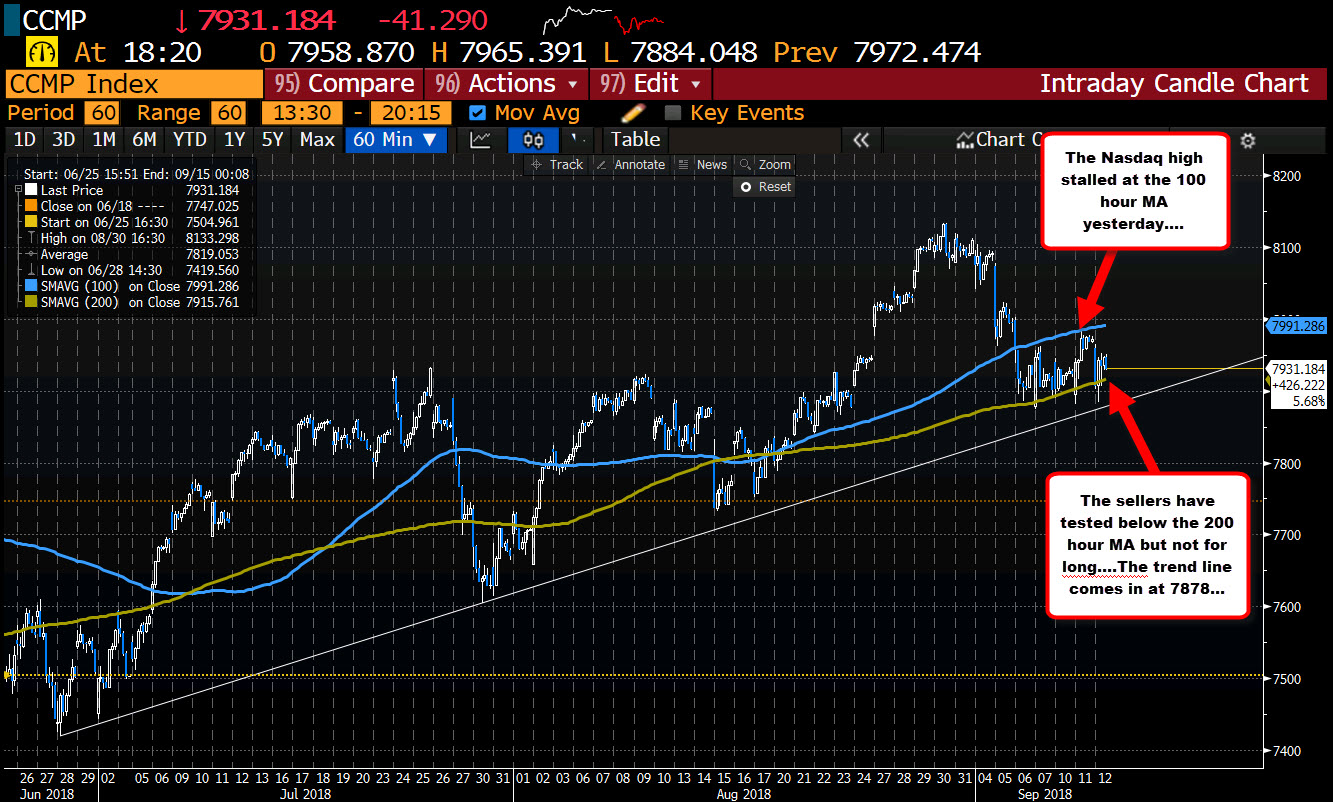
Looking at the hourly chart above, the index fell below the 100 hour MA (blue line) on August 5th and since that time, the price has been able to stay below that MA level. Yesterday, the price went back up to test that MA line and found sellers. The current MA is at 7991.286. There is that reluctance to go above that has me concerned for the buyers. The current price is at 7935 as I type.
Now, admittedly, the price lows since cracking the 100 hour MA, have moved below the 200 hour MA (green line in the chart above) at 7915.76 (currently) on 3 separate occasions, and each break has stalled. So there is a battle going on. Below that MA is a trend line at 7878.
Seller are trying to keep a lid on rallies at the 100 hour MA. Stay below is more bearish. Move above and all the bearish bets are off.
On the downside,cracking below the 200 hour MA and the trend line at 7878 should solicit more selling and turn the bias more to the downside.