The miss in the ADP report yesterday gave the market a bit of relief after a series of strong economic data like Jobless Claims, ISM Manufacturing PMI and Job Openings. The ISM services PMI has also printed bang on expectations, and coupled with the other reports, supports the soft-landing narrative. Moreover, the market was also helped by the fall in Treasury yields and Oil prices which might calm the fears of another inflationary wave. Technically, we are also around key levels and the selloff after the more hawkish than expected FOMC dot plot might need at least a correction.
Dow Jones Technical Analysis – Daily Timeframe
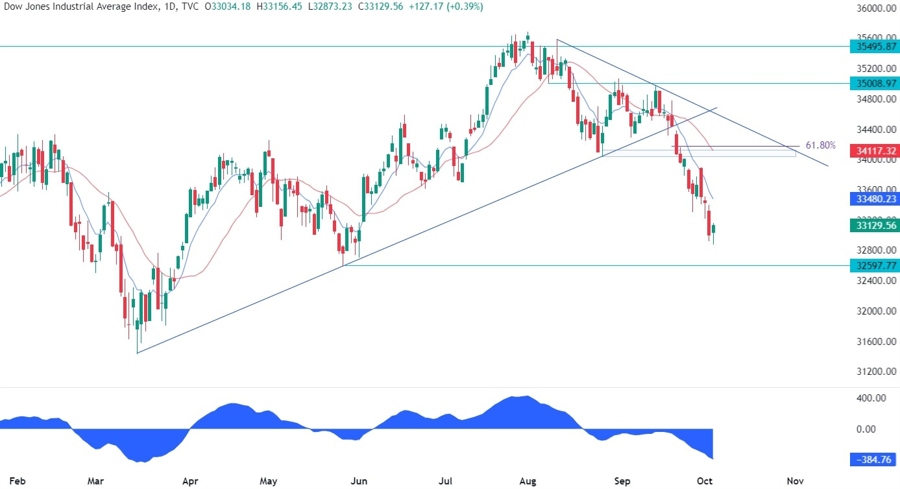
On the daily chart, we can see that the Dow Jones bounced yesterday around the 32900 level helped by the miss in the ADP report. The bearish trend remains intact though as the price continues to print lower lows and lower highs with the moving averages being crossed to the downside. If we see a bigger correction, the best place to lean on for the sellers will be the resistance around the 34000 level where we have the confluence with the trendline and 61.8% Fibonacci retracement level. For now, the target remains the 32597 level.
Dow Jones Technical Analysis – 4 hour Timeframe

On the 4 hour chart, we can see that we have a strong resistance zone around the 33260 level where we have the confluence of the minor trendline, the previous support turned resistance and the 38.2% Fibonacci retracement level. This is where the sellers are likely to step in with a defined risk above the trendline to target the 32597 level and ultimately a break lower. The buyers, on the other hand, will want to see the price breaking above the trendline to position for a rally into the 34000 resistance zone.
Dow Jones Technical Analysis – 1 hour Timeframe

On the 1 hour chart, we can see that the latest leg lower in the Dow Jones is diverging with the MACD which is generally a sign of weakening momentum often followed by pullbacks or reversals. In this case, we should see a pullback into the 33260 level where the sellers are likely to step in, but if the price continues higher and breaks through the trendline, we will have a confirmation of the reversal and the buyers should have free way until the 34000 resistance.
Upcoming Events
Today we have the Jobless Claims report, which continues to show a solid labour market and given the reaction to the miss in the ADP yesterday, we can expect a rally in case of a miss and a drop in case of a beat. Tomorrow, it will be the time for the NFP report which is the only one the Fed will see before its next rate decision.