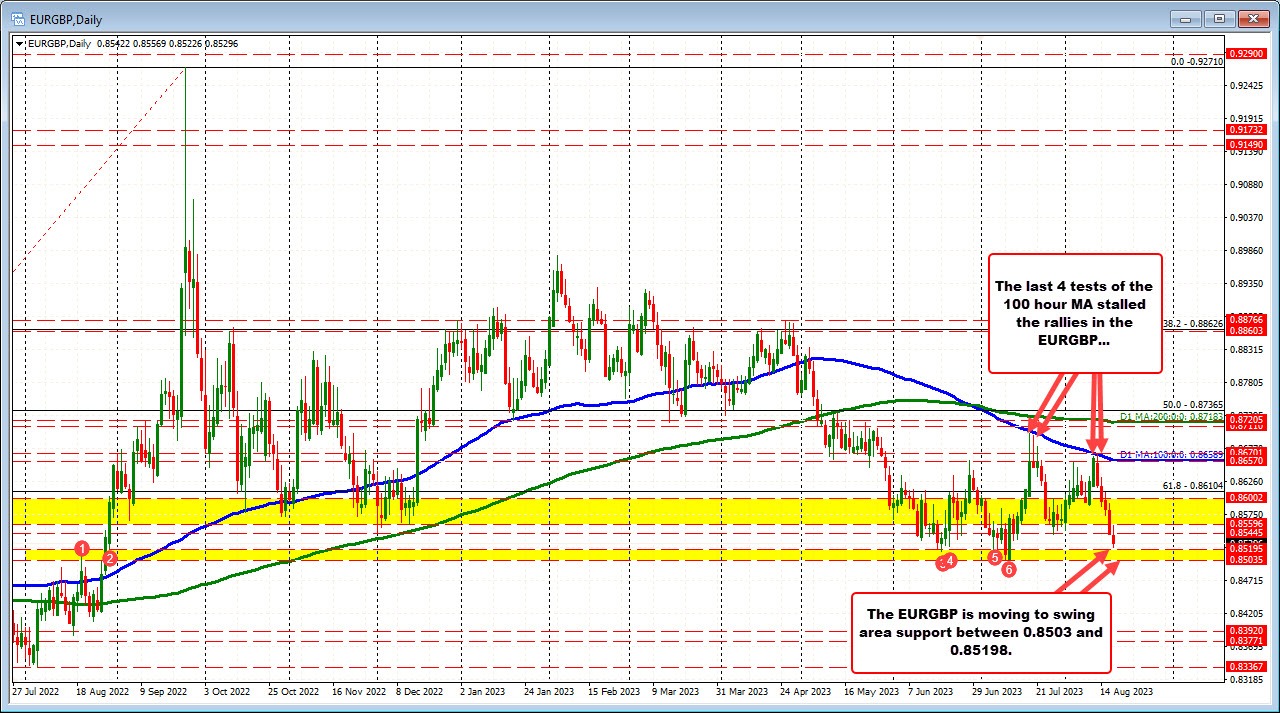
The EURGBP stalled against its 100 day MA after a really earlier in the month. Sellers leaned against that moving average level on 2 consecutive days. Back in July, the price also tested the 100 day moving average for 2 consecutive days and also found sellers.
The last 5 days have seen the pair move lower. That has now taken the price to a swing area on the daily chart that extends back to August 2022 and reestablished in June and July of this year. That area comes between 0.8503 and 0.85195. The low price for the day has reached 0.85226.
Traders looking to buy a dip/oversold levels should look to this area to lean against what they stop below the 0.85000 level. On a bounce higher, a move back above 0.85596 would have traders thinking toward 0.8600, and then the broken 61.8% retracement of 0.8610.
Conversely, a break below the 0.8500 level would open the door for further selling momentum. There is not a lot of support until near the 0.8400 level
