Yesterday, the US CPI report came basically in line with expectations as the market was already expecting higher energy prices to push up the August inflation readings. The Core measure, which is what the Fed is focused on, was in line with forecasts with the monthly figure just a touch higher than expected. The core 3-month annualised rate is now 2.4%, which is a good indicator for the Fed that their policy is working well. Now, the question is whether the labour market softens enough to bring inflation sustainably back to target without a recession. And this is something that never happened in history.
Nasdaq Composite Technical Analysis – Daily Timeframe
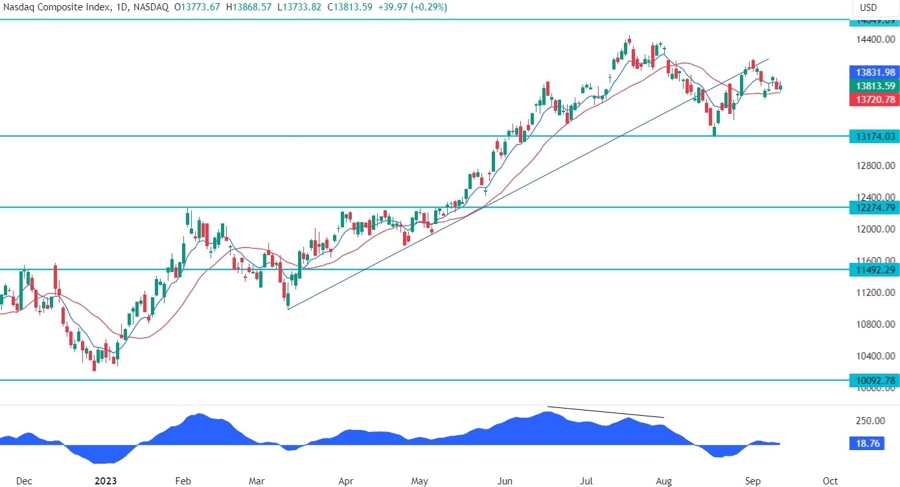
On the daily chart, we can see that the Nasdaq Composite is still consolidating around the support zone at 13810 with the red 21 moving average acting as dynamic support. The bias is more skewed to the upside given that the price has made a new higher high recently around the 14148 level and the moving averages are crossed to the upside but watch out for a break lower as that could open the door for a much bigger fall.
Nasdaq Composite Technical Analysis – 4 hour Timeframe

On the 4 hour chart, we can see that we got a break below the upward minor trendline recently and the moving averages on this timeframe crossed to the downside. This might turn into a bearish flag pattern and the likely target would be the 12274 support. The buyers will need a strong bounce on this support zone to invalidate the bearish setup, while the sellers will want to see the price continuing lower to confirm the breakout of the pattern and pile in to position for the selloff.
Nasdaq Composite Technical Analysis – 1 hour Timeframe

On the 1 hour chart, we can see the tight range the Nasdaq Composite has been trading in for the past week. The levels to watch are the last higher high at 13934 and the last higher low at 13732. In fact, a break to the upside should see more buyers piling in and extend the rally into a new high. The sellers, on the other hand, will want to see the price breaking below the 13732 low to make a new lower low and pile in to target the 13174 support.
Upcoming Events
Today is likely to be a volatile one given that we are going to see lots of top tier economic indicators released at the same time. In order of importance, we will get the US Jobless Claims, Retail Sales and PPI data. The September FOMC meeting is already a done deal as the market is pricing a 97% probability of a pause, so the data is going to influence the November and December expectations. Tomorrow, we conclude the week with the University of Michigan Consumer Sentiment report.