The NASDAQ index is trading in volatile up and down fashion today.
The NASDAQ index initially moved higher shortly after the open, rising by 73.3 points before rotating sharply to the downside and declining by -185.2 points at the session lows. That's a swing of about 1.72% from high to low.
The index is currently trading up around 15 points or 0.10% at 15115. The low price reached 14914.90. The high price was up at 15173.40. The NASDAQ index fell by -3.34% yesterday.
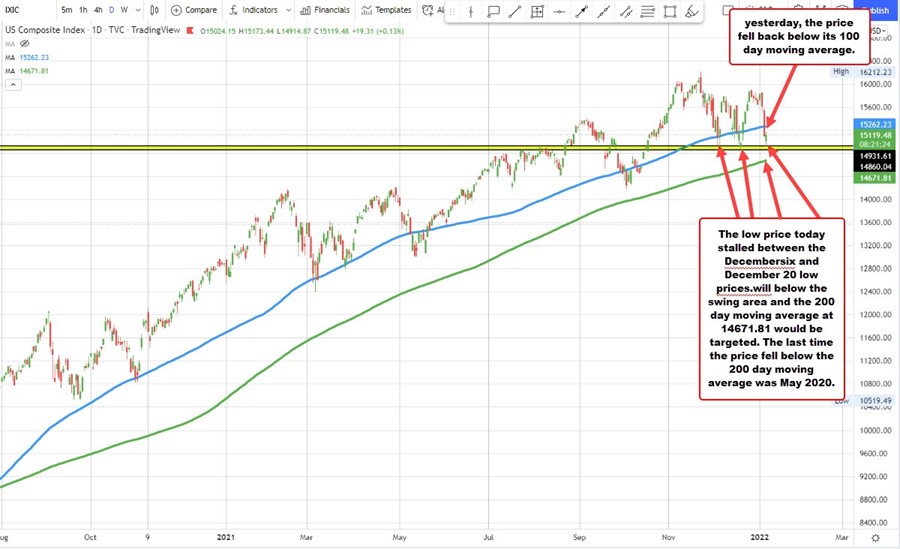
Looking at the daily chart, the price yesterday fell back below its 100 day moving average at 15262.26. Today, the low price tested the December lows between 14931.61 and 14860.04. Once again the low price came in at 14914.87 between those extremes.
Going back to October, the price of the NASDAQ index has moved below its 100 day moving average on now five separate occasions, but each of the falls have failed to get close to its rising 200 day moving average. That moving average currently comes in at 14671.81 in moving higher. Last time the price traded below its 200 day moving average was back in May 2020. A move to the 200 day moving average would be a fall from the all-time high of around 9.3%.