Fundamental Overview
The Nasdaq bounced strongly from the lows yesterday following good US Jobless Claims figures as the data quelled some of the fears around the labour market after the weak US NFP report last Friday.
The market pricing for rate cuts eased a bit but remains quite elevated with a 55% probability of a 50 bps cut in September and a total of 103 bps of easing by year-end. If the NFP report was indeed negatively impacted by Hurricane Beryl, which is what has been transpiring from the data, then we can expect the market to go back to the old script of resilient growth and positive risk sentiment.
Moreover, the Japanese markets shouldn’t be a problem anymore given that the Japanese officials made it pretty clear that they won’t proceed with more tightening given the volatility in the markets.
Nasdaq Technical Analysis – Daily Timeframe
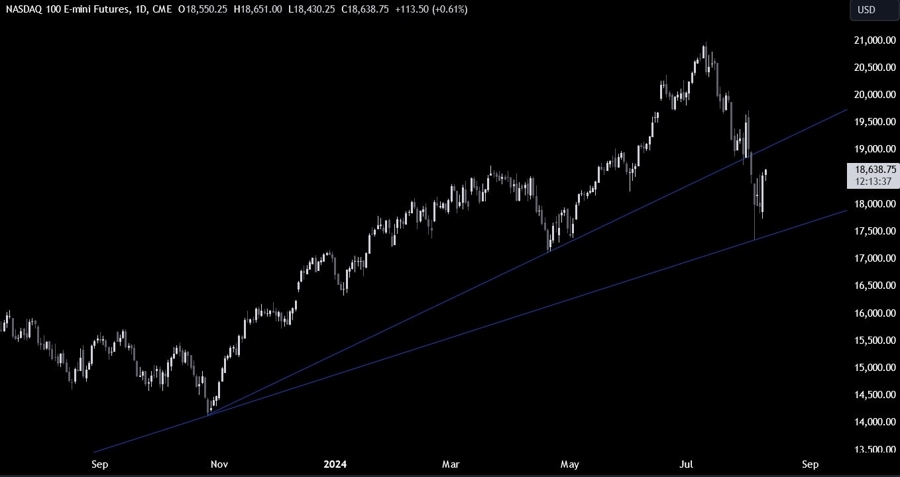
On the daily chart, we can see that the Nasdaq eventually bounced on the trendline around the 17400 level and extended the gains following the US Jobless Claims figures. The target for the buyers should stand around the broken trendline at the 19000 level. That’s where we can expect the sellers to step in with a defined risk above the trendline to position for a drop back into the lows targeting a breakout.
Nasdaq Technical Analysis – 4 hour Timeframe
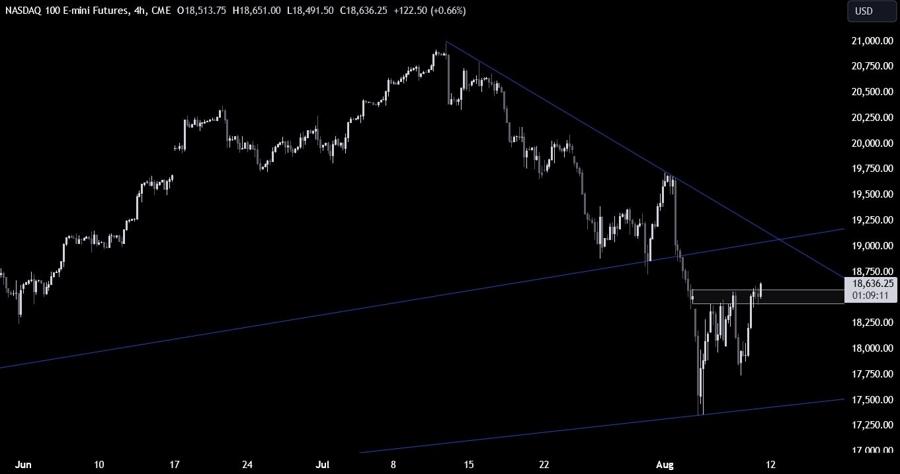
On the 4 hour chart, we can see that we had a strong resistance zone around the 18500 level but the price is breaking out today. We can expect more buyers piling in with a defined risk below the zone to increase the bullish bets into the 19000 level. The sellers, on the other hand, will want to see the price falling back below the zone to position for a drop back into the lows.
Nasdaq Technical Analysis – 1 hour Timeframe
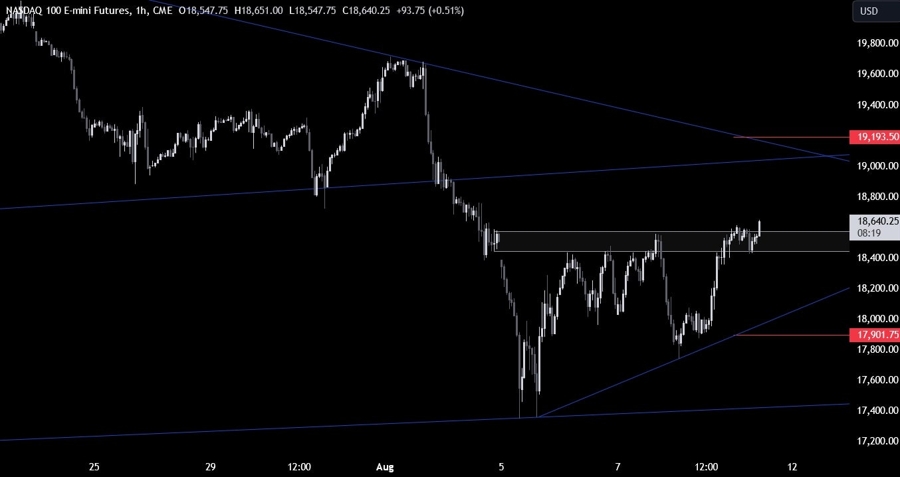
On the 1 hour chart, we can see that in case the price were to fall back below the zone, we might see a pullback into the upward trendline. That’s where we can expect the buyers to step back into the market to position for a rally into the 19000 level with a much better risk to reward setup. The sellers, on the other hand, will want to see the price breaking below the trendline to increase the bearish bets into the lows targeting a break below the major trendline. The red lines define the average daily range for today.