The NFP report released last Friday did better than expected in terms of the headline number, making it the 14th consecutive positive outcome. However, when we look at the specific details, they weren't that great. The unemployment rate went up from 3.4% to 3.7%, which is the largest increase since the pandemic started. The average number of hours worked per week also decreased, which usually happens when employers are preparing to lay off people.
Overall, different people found something to support their viewpoints. The optimists saw solid job growth, but they also noticed the higher unemployment rate and lower average hourly earnings as signs of a less tight labour market that could reduce inflationary pressures. The decrease in average weekly hours worked might be seen as a return to the trend before the pandemic.
On the other hand, pessimists focused more on the details instead of just looking at the headline number because trends are usually more important than absolute figures.
Yesterday, the US ISM Services PMI was much lower than expected at 50.3, barely avoiding a contraction. The employment sub-index showed a decline, and the prices paid sub-index decreased significantly, going back to the level observed in May 2020. As a result, the market adjusted its expectations on interest rate hikes from the Federal Reserve on the dovish side.
NZDUSD Technical Analysis – Daily Timeframe
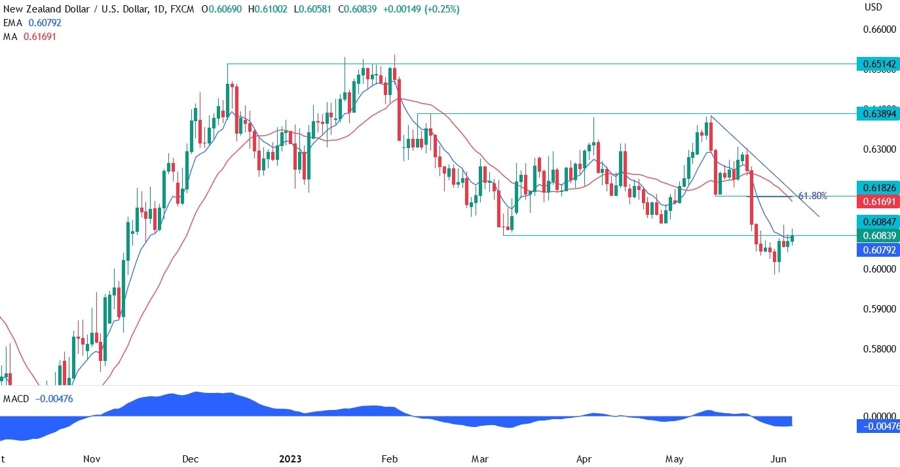
On the daily chart, NZDUSD breakout looks to be failing as the price is now challenging the support turned resistance. Given that recently the US data started to disappoint, and the market is repricing hawkish Fed bets on the more dovish side, we may see the USD weakening further going forward. The target on an upside break is the 0.6186 level where we can find confluence with the 61.8% Fibonacci retracement level and the trendline.
NZDUSD Technical Analysis – 4 hour Timeframe
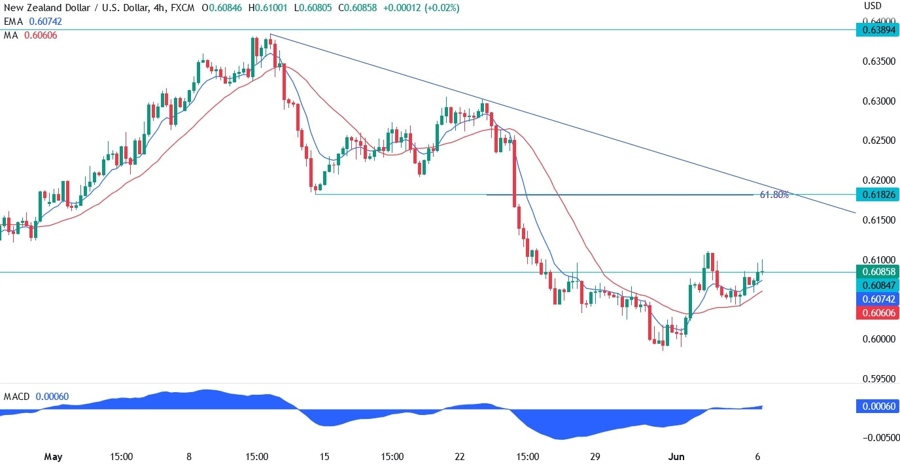
On the 4 hour chart, we can see more closely the current price action and how the market is challenging the 0.6085 resistance. The moving averages have crossed to the upside signalling a bullish momentum and a possible short-term uptrend. The price recently bounced from the red 21 moving average that acted as dynamic support and we can expect it to continue to do so. The target on an upside extension should be the 0.6182 level, while a break below the 0.6040 level should increase the bearish momentum and take NZDUSD to new lows.
NZDUSD Technical Analysis – 1 hour Timeframe
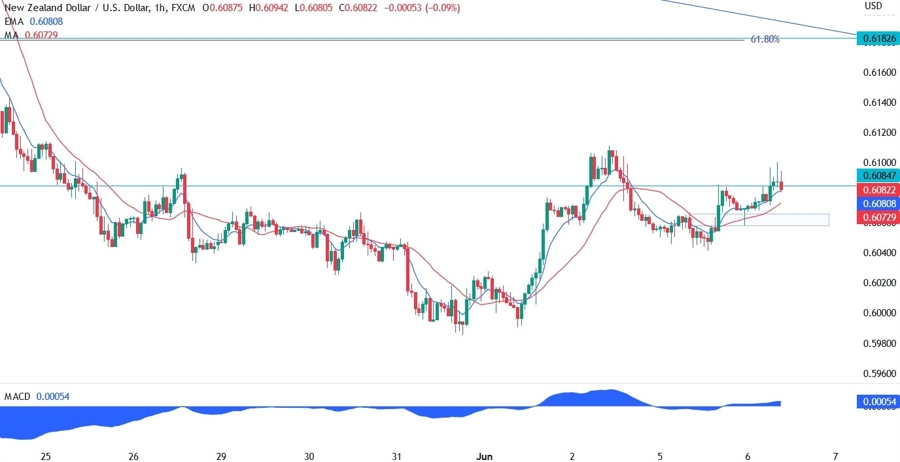
On the 1 hour chart, we can see that the price is struggling a bit at the resistance level but even if we get a pullback, the buyers should lean on the support zone at the 0.6060 level with a defined risk just below it. A break of the 0.6100 handle should give the buyers more conviction and extend the rally towards the 0.6182 level. The sellers, on the other hand, will want to see the price breaking below the support zone at 0.6060 to pile in and target the 0.5985 low first and a new lower low next.

