The major US stock indices are moving higher with the NASDAQ index approaching 1%, and the S&P index up nearly 0.75%. At session highs, the NASDAQ index is testing its 100 and 50-day moving averages. Those levels come in at 13592 and 13623 respectively. It will take a move above those moving averages to increase the bullish bias.
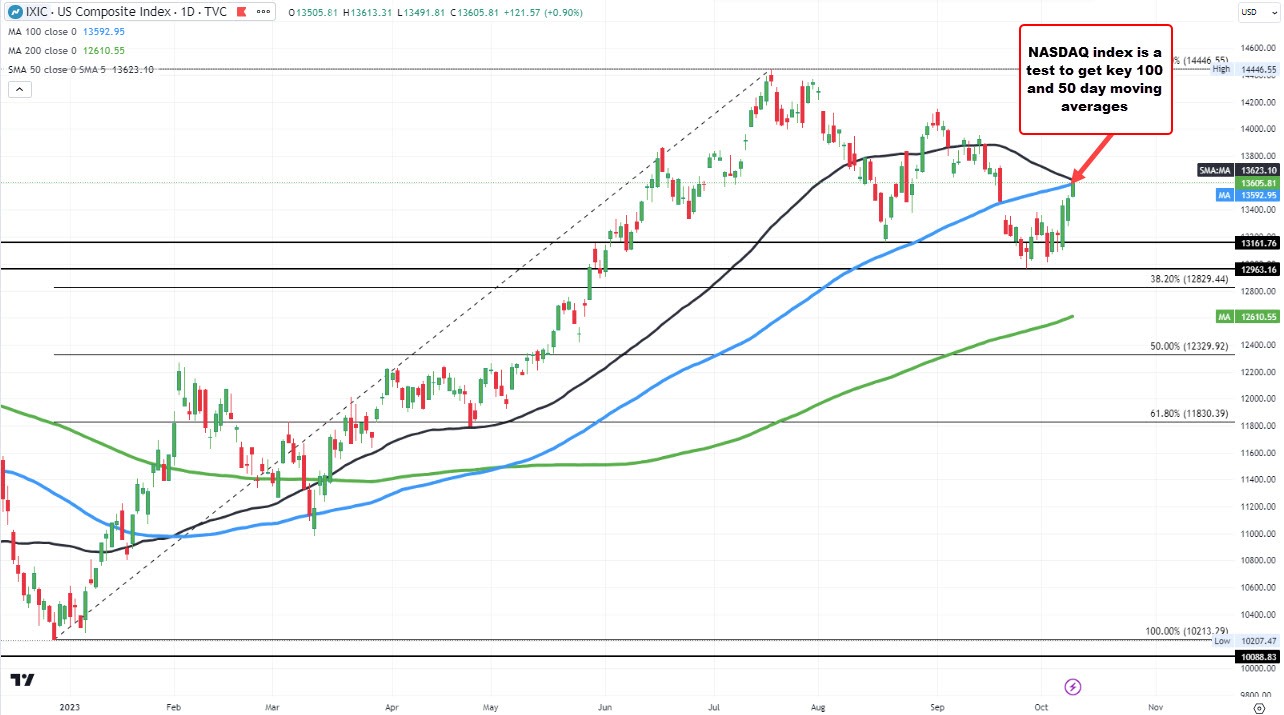
NASDAQ index tests its 100 and 50 day moving averages
Conversely, the S&P index is moving above a swing area between 4325.28 and 4335.31. Stay above each of those levels keeps the buyers and control in the short term with work to do. That work includes getting back above its 100 day moving average at 4397.52, and it's 50 day moving average of 4415.04.
