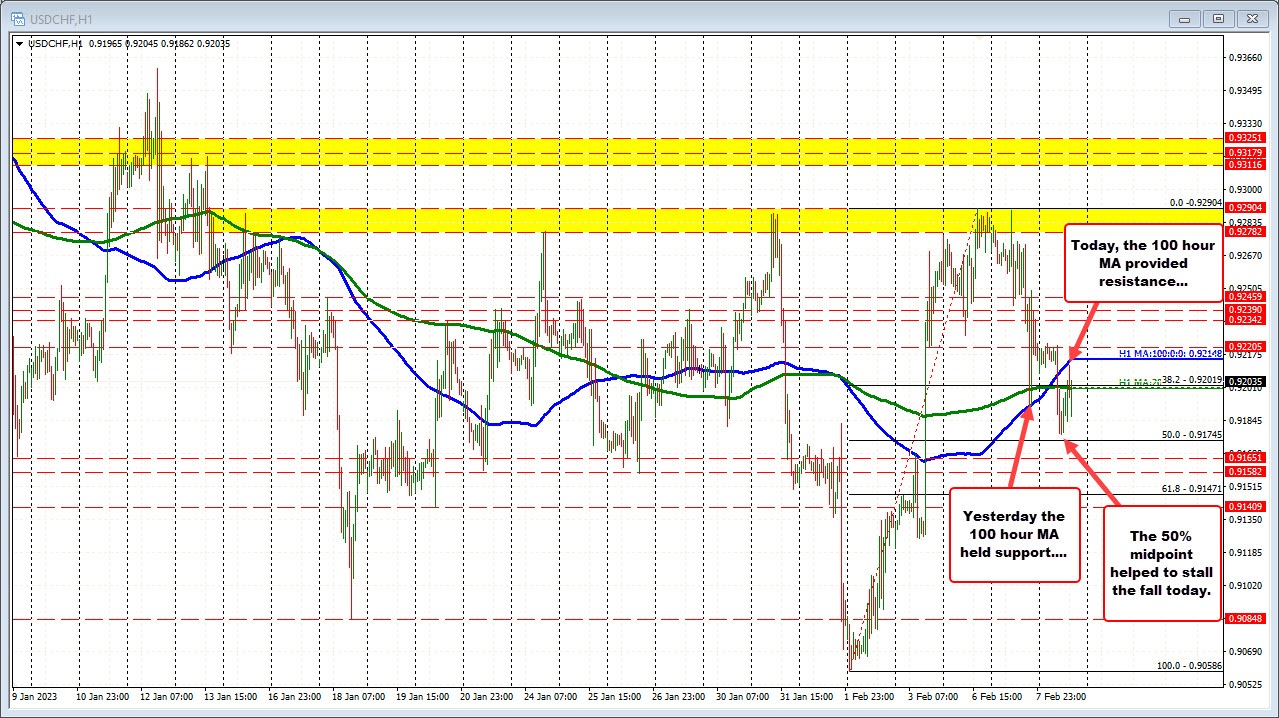
The USDCHF shifted the technical bias to the downside today after falling below the 100 and 200 are moving averages. Recall from yesterday, the fall to the downside got below the 200 hour moving average (green line in the chart above), but found support buyers against the 100 hour moving average below (blue line in the chart above).
In a trading today, the price started the day above both those moving averages, only to make a move lower during the early European session. The move to the downside took the price closer to the 50% midpoint of the February trading range near 0.91745. The low price reach 0.91775 before bouncing higher.
The rotation back to the upside was able to get above the 200 hour moving average near 0.92019 (that is also near the 38.2% retracement), but stalled once again against the 100 hour moving average (blue line).
So for successive days, the 100 hour moving average has been a key turning point. Yesterday the market found support against it. Today the market found resistance against the level.
On the support side of the equation, the 50% is the level that if broken would increase the bearish bias (at 0.91745)