Ceiling at the 100 day MA stalls the rally. Trades below the 100 hour MA now
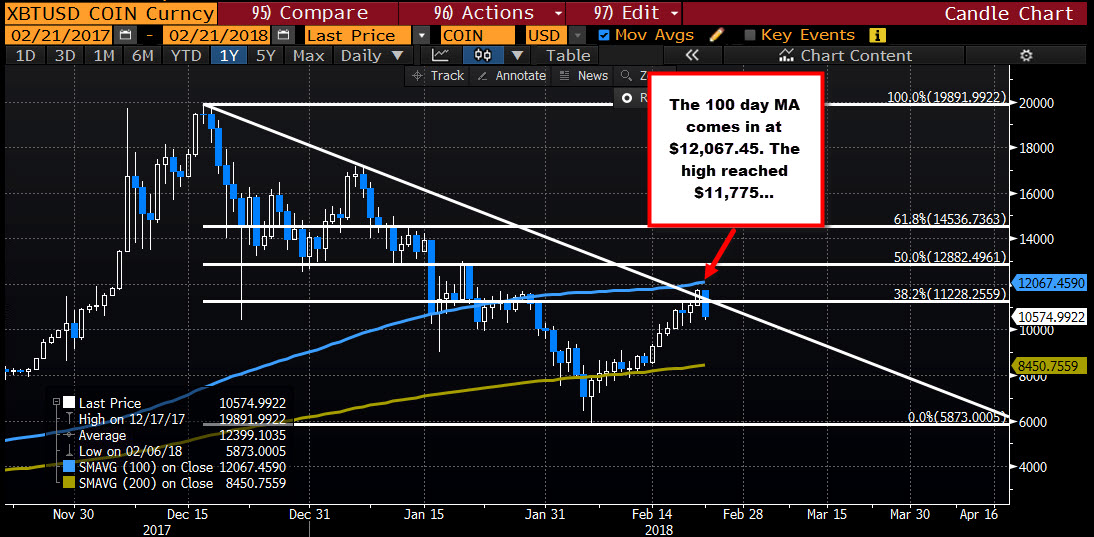
The price of bitcoin (on Coinbase), did work closer to the 100 day MA in trading yesterday. The high for the day reached $11,775. The 100 day MA is up at $12,067. That is fairly close. Sellers kept a lid against that MA line (see blue line in the chart below). The price started to move lower. We currently trade at $10573, down over -$1,100 on the day now.

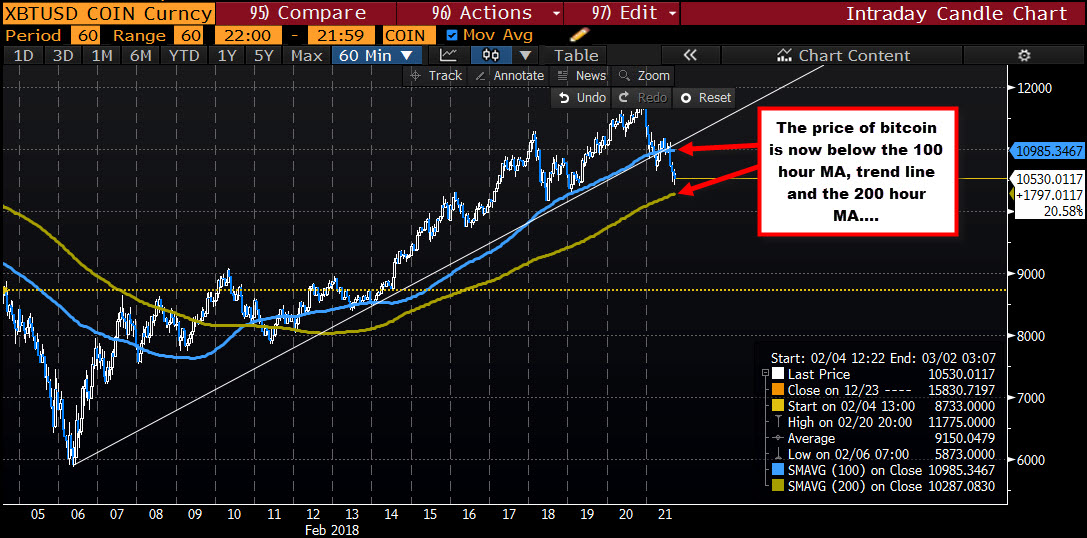
Drilling to the hourly chart, the price decline has been able to take the price back below the 100 hour MA. The fall, did have a period where the price traded above and below that MA line (see blue line in the chart below), but the last few hours has seen more selling AWAY from that MA line.
The next key target below is being approached at the 200 hour MA (green line in the chart below). That MA comes in at $10287.22 currently. I would expect that on a test, the buyers will lean but have stops on a break.

SUMMARY: So the sellers have started to take some control back from the buyers in the stall against the 100 day MA above, and then via the fall below the trend line, and 100 hour MA on the hourly chart. Stay below the 100 hour MA will keep sellers content but the 200 hour MA will still need to be broken to get more selling restarted.


