Key close for the digital currency

The price of Bitcoin is trading down -$516 at $8821. The run lower this week has taken the price from a high of $11,645 to a low today of $8370 today. That is a -28.1% decline from high to low. Yes, the price is off the low, but at $8821, it is not too far from the low.
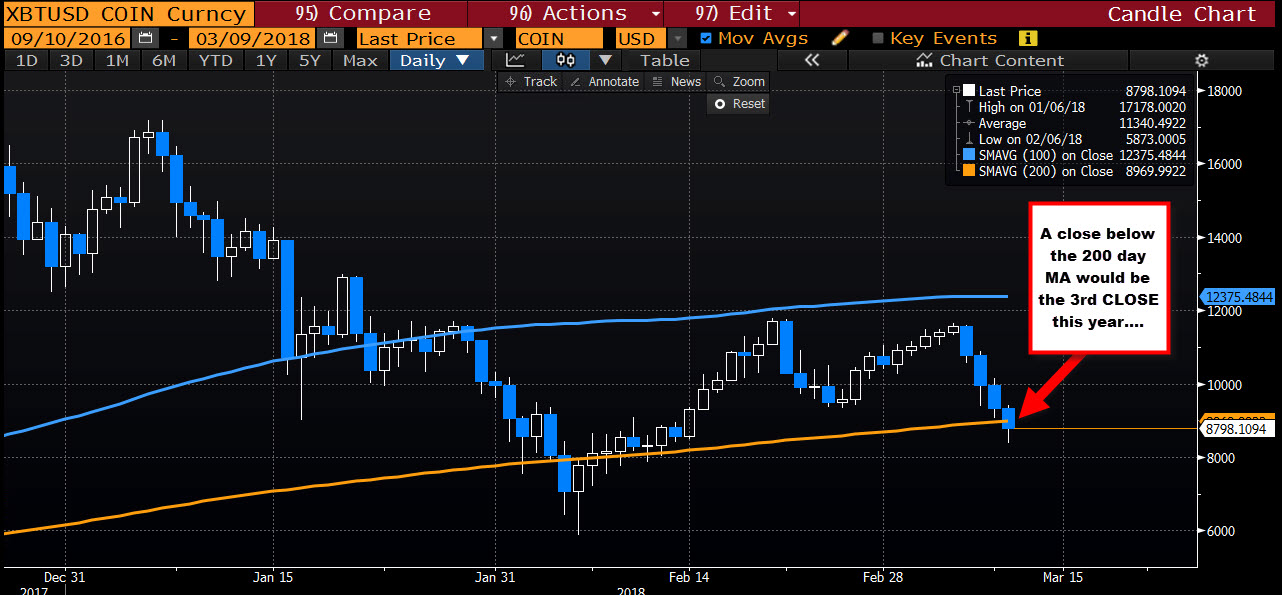
Technically, the price is currently trading below the 200 day MA at $8969.86 (see green line in the chart above). That is key. That is bearish.
In early February, the price moved below that MA line and closed just 2 days below that line There were 8 days when the price traded below in February, but only 2 closes below the MA line. The last time the price traded below the 200 day MA before the February dip, was back in October 2015. The 200 day MA should not to be ignored.
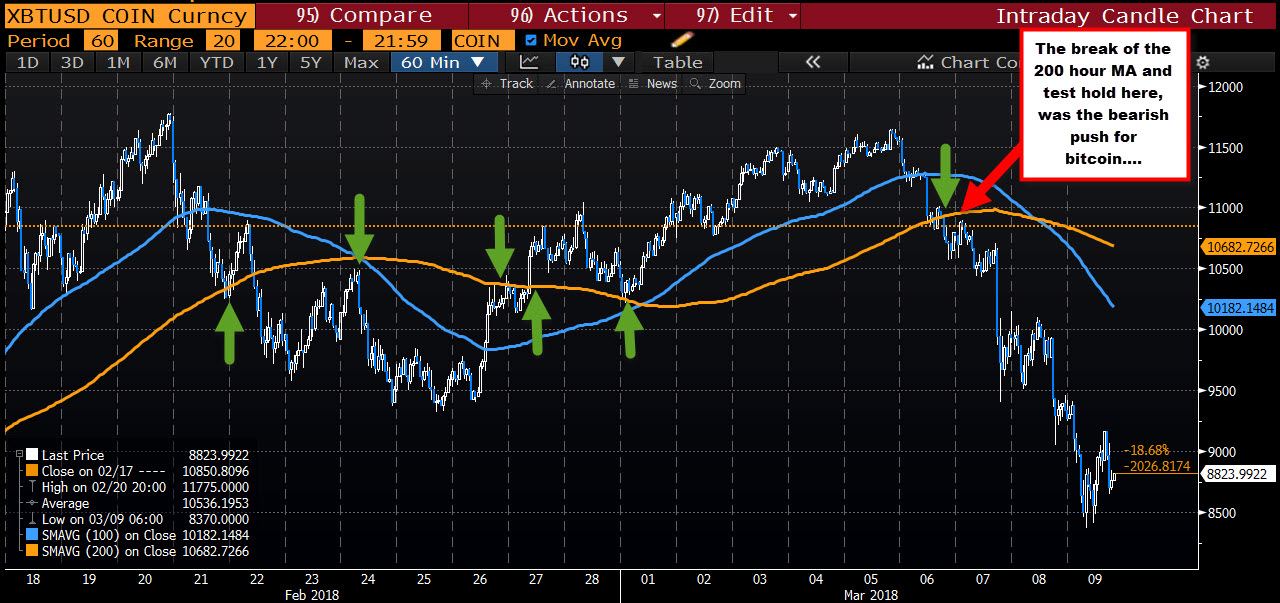
Drilling down to the hourly chart below, the price of bitcoin, had been rotating above and below the 200 hour MA. This week the break and the successful retest of the MA was the catalyst for the decline.
Fundamentally, the move lower this week was helped by a reported heist of coins in a hack, and the expectations of more regulation in the US. The US is also looking for taxes being paid on the trading gains. All of that has taken some of the luster from bitcoin.
The technicals simply tell the story via the price action and tools applied to that price action.

What is clear now is that if the price stays below the 200 day MA (and closes below today), that is more bearish. It is as simple as that.


