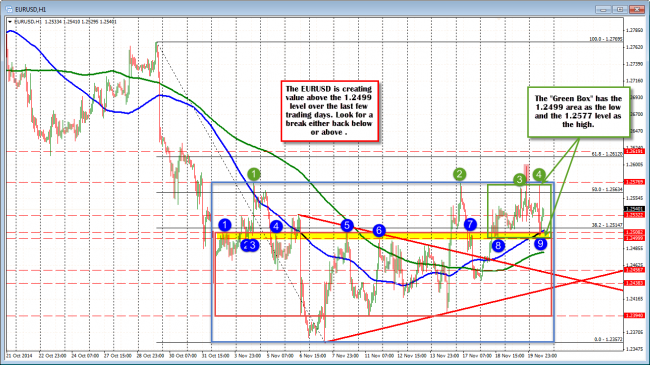
I have been talking about certain “areas” for the EURUSD over the last few days (see last post “EURUSD tests NY session lows at 1.2523). I even put boxes around them – one blue and one red (see chart below). I have said the EURUSD is trading in a Land of Confusion (“Forex Technical Trading: EURUSD stays in the Land of Confusion (with a more bullishness today“). I also talked about the levels in my video done near the NY close yesterday (You can view that by going here: https://www.forexlive.com/blog/2014/11/20/forex-technical-analysis-video-5-currencies-in-5-minutes-november-20-2014/ It is worth a look for a view of the areas of importance and why.

EURUSD creating value above the 1.2499 area.
Although traders may not really know/believe in the moves in the EURUSD (either to the upside and the downside) and thus remain in a Land of Confusion where the sellers sell highs and the buyers buy lows, I do get the picture in the EURUSD. The boxes and moving averages are holding. The top of the Red Box held support in trading today at the 1.2499 area. The top of the Blue Box held the high at the 1.2577 area. Apart from one hourly bar that stretched above the Blue Box extreme yesterday after the FOMC Meeting Minutes, the pair over the last few days has stayed within the confines of the new “Green Box” – i.e., the area between the 1.2499 and the 1.2577.
The good news – and I am looking forward to this as I won’t feel obligated to draw the same boxes or talk about them – is that the price will eventually break out of the Green Box, Red Box and Blue box, stay outside those boxes, and should “move away”.
Don’t you get sick of certain things after a long time and want to “move away’ or have a change?. Same is true with trading/traders. Non trending (which we are experiencing now) will make a break to trending. It may require more clarity from economic data. It may start from a short or long squeeze. What often happens is also gets a clue from the technicals. Instead of going through the 100 hour MA, it may bounce off the 100 hour MA like it is doing today. It may also show signs of breaking like it did yesterday with the move above the high, only to have the price fail.
The point is, eventually, the market gets tired of selling high and buying low and a trend move that typically are fast, directional and have greater trading ranges, is the result. Trends are where the most money is made.It is also where the most money tends to be lost. So don’t be lulled by non-trending. Instead be aware and on the lookout for the technical clues of a potential change in attitude from the buyers or sellers. It could be the start of something bigger to come.
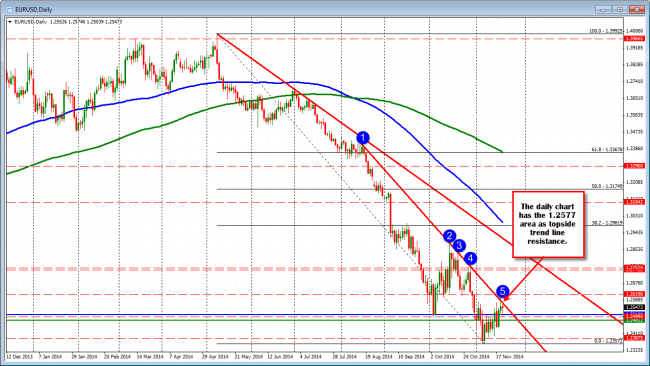
Today there is a bunch of data out of the US in the form of Initial Claims, CPI, Markit PMI, Philly Fed Index, Leading Index and Existing Home Sales. In Europe this morning the Markit PMI data was less than stellar with each of the measures falling and lower than expectations in EU and Germany. The fall off the data stopped at the support. Was it the market’s way of telling us “the bottom is in”? or is the market saying “show me the US data and we will decide then?” I feel the decision will be made and we will see a break outside the “Green Box” today. Making the trade decision more difficult is the hourly chart is more bullish with the value being established above the 1.2499 level but the price respecting the topside trend line on the top (yes it cuts across at the 1.2577 level – see daily chart below). It is a coin flip but with the price near the middle, the risk is the boundaries. Flip the coin. Choose your side (or stay aside and wait)
Heads = EURUSD Down. Tails = EURUSD Up. For me. Heads, but small. Will look for a break for the next clue to the next move (PS on an upside break, watch 1.2612-19 area for sellers).

EURUSD has topside trend line resistance at 1.2577.


