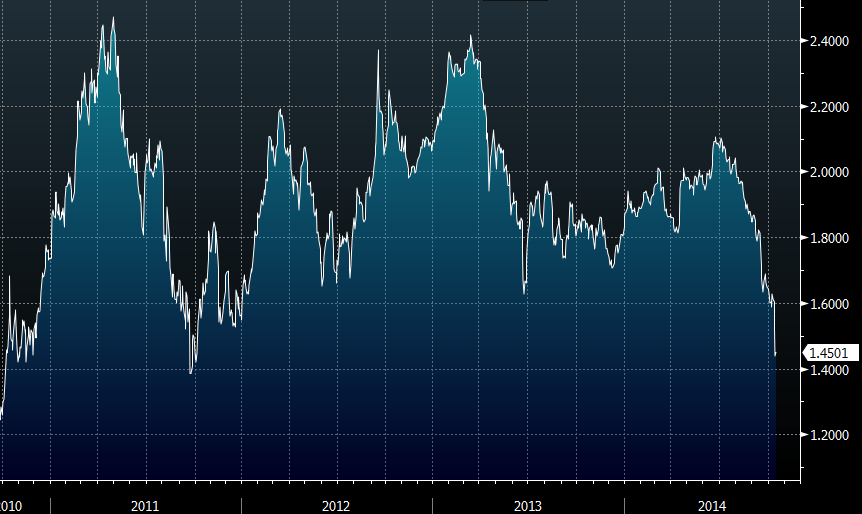
These are 5-year breakevens and they’re the best indicator of how the market feels about inflation.
That said, with the Fed constantly mingling in the bond market there’s some doubt about just how good of an indicator it might be.
In any case, this is what prompted Bullard to say the Fed could consider delaying the taper.

US 5 year breakevens
The chart, which is Treasuries plus TIPS, indicates inflation of just 1.46% over the next 5 years — well below the Fed’s target.


