How to plan your trades using Japanese candlesticks
Japanese candlesticks and their patterns can be
a valuable source of information for Forex traders. We examined their structure
and patterns in the previous articles. This time, we'll focus on applying the theory to practice
and see how one can use the logic of candlesticks for opening trade positions.
Have a plan
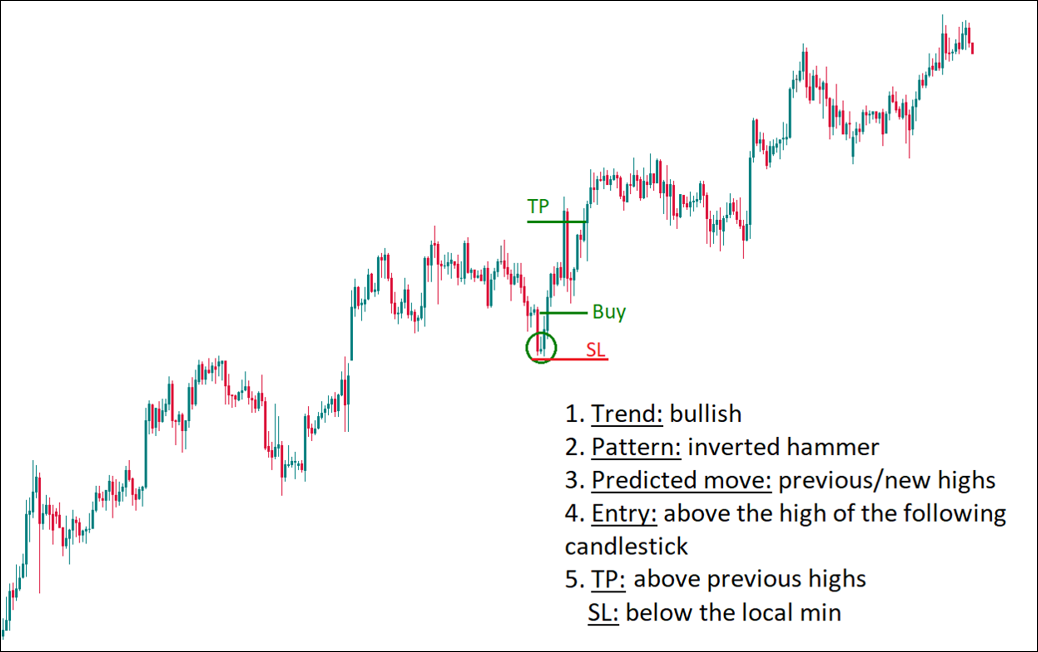
Every strategy needs a set of rules and should consist of consecutive steps. When you are using candlesticks to enhance you trend trading efficiency, your plan can look like this:
- Define trend: find the path of the least resistance for the price.
- The setup: find a candlestick pattern (in particular, look for the local reversal patterns near support/resistance areas or continuation patters of the main trend).
- The predicted move: define the projected target of a pattern (look at the previous highs in an uptrend and the previous lows in a downtrend).
- Entry: determine the levelwhere you will enter a position.
- Exit: find a place for Take Profit and Stop Loss.
At the picture below, you will find the example of such trade. You can see that it's rather austere in terms of tools: there's only an uptrend (defined by the presence of higher lows and higher highs) and a candlestick pattern.
This is a workable price action base which, if necessary, may be accompanied by other instruments. The key idea is to stay disciplined and to follow the framework you've chosen. We can't help mentioning that an understanding of fundamentals may nicely strengthen this approach. Simple and elegant.

There are trading strategies based on specific combinations of candlesticks. For example, the so-called "Third candlestick" strategy. The high and low of the first candlestick should be above that of the previous candle.
The second candlestick should be bearish. A sell trade is opened at the start of the third candlestick (a confirmation from Stochastic oscillator is welcome). Take Profit is usually located at the close of the third candlestick and the Stop Loss can be above the high of the candlestick 1.

There are tools that can make recognizing candlestick patterns easier - various custom indicators for MetaTrader that mark the patterns on your charts. You can find these indicators in the Internet and experiment. Of course, no indicator is perfect.
Usually the machines identify patterns according to some formal signs like relative size of candlesticks' bodies and shadows. After you see a hint from such indicator, you will need to make a judgment on the quality of a pattern. For example, a bullish engulfing pattern is strong if it formed after a sizeable decline of the price.
Go beyond price action
What if we combine Japanese candlesticks with some technical indicators? Man doesn't live by candlesticks alone. In the all-time market classics "Japanese candlesticks charting techniques", Steve Nison spends a great deal of time and paper explaining how to use candlesticks in combination with other techniques of technical analysis. Let's make a small overview of this idea.
If candlesticks with long upper shadows form at resistance lines or levels, it means that the break up was unstained and the price is about to reserve back down. Moving averages with big periods (200, 100 and 50) can act as the borders of trends as well.

You can also use moving averages for a simple strategy like at the picture below:

Remember your friend
Trading is a game of probability, and you have to go with the highest one. This leads to the benefits of trend trading as the safest way to make money. In bullish trend, look for bullish candlestick patterns for the opportunity to buy.
If you see a bearish candlestick pattern, you may be inclined to ignore it or at least to look for a better conformation before implementing a sell signal. Understanding the market helps you use the most appropriate candlestick patterns and make the best trading decisions.
Seek confirmation of reversals
Let's have a look at another type of technical indicators - oscillators, for example, RSI. Trading on the basis of this indicator alone (i.e. buying it falls to 30 or selling when it rises to 70) is dangerous.
However, when you use this RSI signal together with a signal from a candlestick pattern, it can produce decent results. You can also take the divergences between RSI and the price chart into account.

Conclusion
Candlesticks are a source of power. Make sure you know reversal and continuation patterns and then incorporate this knowledge to your own trading strategy. Good luck and may the Force be with you!
- This article was submitted by FBS


