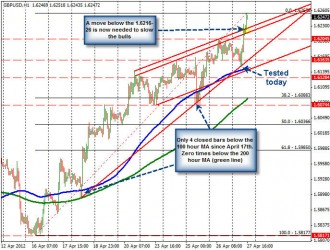
The GBPUSD has now rallied from a low of 1.5717 to a high of 1.6255 (538 pips) in 10 trading days. Along the way the price has been able to stay above the 100 hour MA (blue line) for all but 4 hourly bars (since breaking above on April 17th). The price has not been below the 200 hour MA (green line) since breaking above on April 17th (see chart above).
Today, the price accelerated the trend higher – breaking above topside trend line resistance lines (see lines in the chart above). Those levels come in at 1.6226 and 1.6216 respectively currently. These are now support levels below. The trend higher would be in question if these levels can be breached to the downside. Until then, the bulls remain in charge.
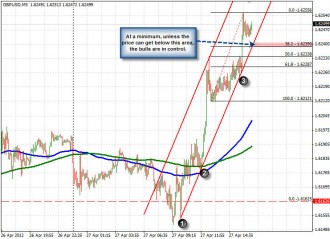
Looking at the 5 minute chart more aggressive sellers might look for a break of the steep trendline today. That level comes in currently at the 1.6239 level. The 38.2% of the last leg higher in the pair today also comes in at that level. If the price cannot get through these levels (followed by the 1.6216-26), the longs stil rule and control the trend move.
Remember, in a trend the burden of proof is on the sellers to overwhelm the buyers. If they cannot push the price below the most recently broken technical levels, they are not proving their selling strength. Watch those levels for proof of a potential top.


