
This a snippet from Goldman Sachs weekly technical analysis chart pack on currencies. On the euro against the USD.
I am not an Elliot Wave person, perhaps those who are would comment on the piece?
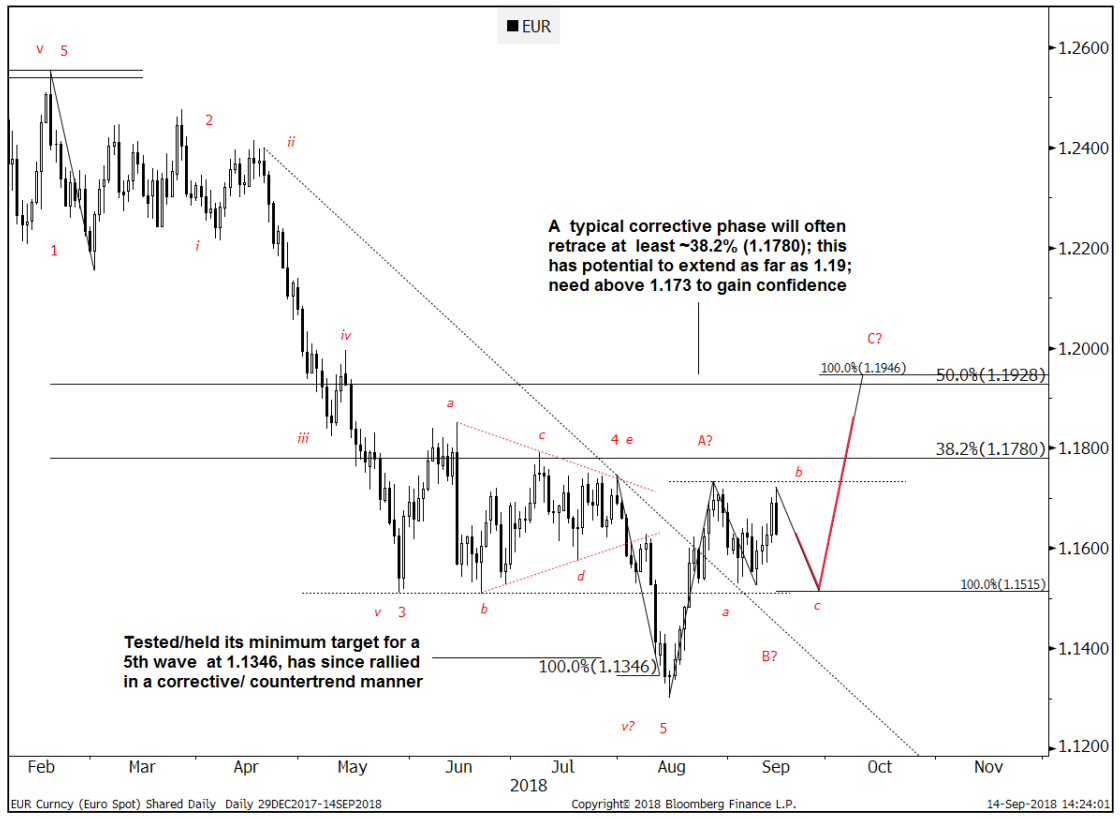
As a reminder, the market has been in a corrective process since the August low
- It's since formed the A and B legs of an incomplete ABC corrective advance. The next important level in focus is 1.1515; targeted support for wave B. This should be an area to consider re-engaging in topside exposure. From there, an eventual B wave could extend as far as 1.1928- 1.1946. Confidence in reaching this level would increase above the 1.1733 high from late-August.
- Getting to 1.1928-1.1946 would then complete a full corrective process. After which EURUSD should in theory be in a better place to resume its underlying downtrend. The alternative is that wave B endures for a while longer, in a complex range consolidation; i.e. sideways between 1.15/1.17 for a period of time. Would have to break further than 1.15 to really call into question this underlying bias.
View: Watch for support to hold near 1.1515 and no lower than 1.15. Target 1.1928-1.1946. Confidence will increase above 1.1733. Consider downside exposure if/once ~1.19 is reached
ps. Chart date is 14 Sep (Friday last week), bear that in mind

