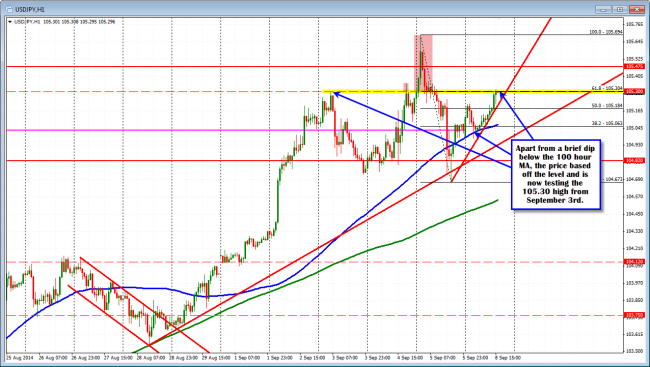
The USDJPY tested and held the 100 hour MA in trading earlier today and is now testing resistance against a high from last week and fibonacci retracement area.
That level comes in at the 105.30 area which corresponds with the high from September 3rd and the 61.8% of the move down from Friday’s high. Earlier today, the price based against the 100 hour MA (blue line in the chart below – at 105.07 currently) and moved higher. Stay above this MA line this week and the buyers remain in control. On Friday the price moved lower and below the 100 hour MA after the weaker US employment report. However, that push failed. Today, there was a brief look below the 100 hour MA but that too failed (one hourly bar dip – see chart below). Failures often tell you that there is little support for the break.

USDJPY held the 100 hour MA below. Tests next topside target.
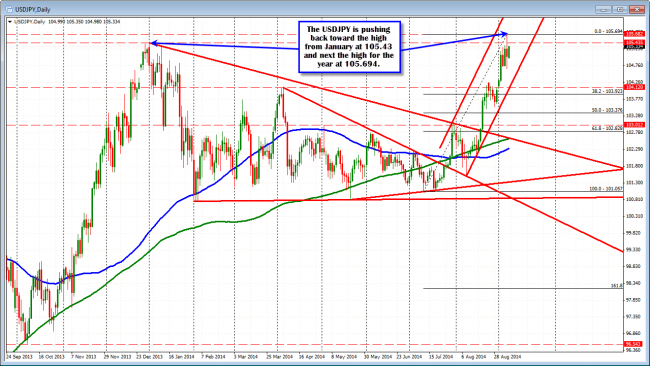
Looking at the daily chart the high from the 1st trading day of the year (the high for the year before last weeks look above), came in at 105.435 and this along with the high from last week at the 105.69 level.

Not much resistance above . High from January and last week are it.
The traders/market are remaining more bullish for the pair. The opportunity existed for a move lower on Friday – and again today on the dip below the 100 hour MA, and the buyers came in. So I have to give the nod to the buyers until they can prove they mean it (via a move below the 100 hour MA).
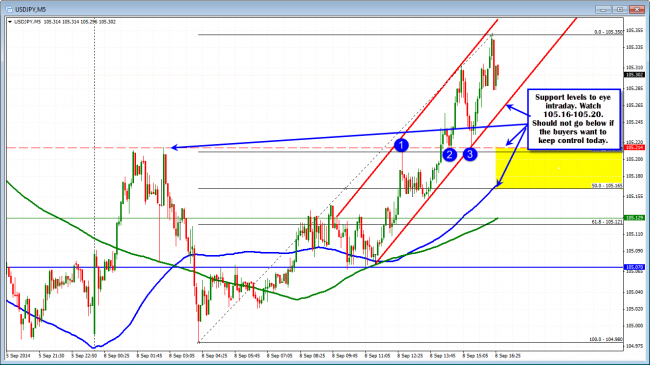
There is interim support today which I will be eyeing for support. Looking at the 5 minute chart below the 105.16-20 area has the:
- High from Asian session
- 38.2%-50% of the range today
- Was a high and low in London session
- 100 bar MA (blue line in the chart below)
If the buyers are to remain in control today, that area should hold.

USDJPY has support at the 105.16-20 intraday


