
- Prior month 45 dollars to 44
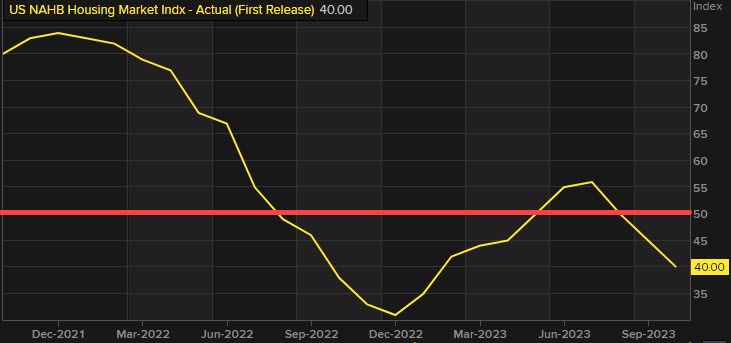
- NAHB housing market Index for October 40 vs 44 estimate. Lowest level since January 2023. The index has fallen for the 3rd straight month
- Single-family sales current 46 vs 50 last month. Lowest since January 2023
- Single-family sales next 6 months 44 versus 49 last month. Lowest since January 2023
- The traffic of prospective buyers 26 versus 30 last month. Lowest since January 2023
Regionally
- Northeast 47 versus 48 last month
- Midwest 37 versus 38 last month
- South 43 versus 48 last month
- West 35 versus 42 last month
The NAHB/Wells Fargo Housing Market Index (HMI) is based on a monthly survey of NAHB members designed to take the pulse of the single-family housing market. The survey asks respondents to rate market conditions for the sale of new homes at the present time and in the next six months as well as the traffic of prospective buyers of new homes. The HMI can range between 0 and 100.
The most recent low was 31 in December 2022. The high for 2023 was at 56 in July. The high in 2022 was at 83 in Janauary 2022.
Higher rates and low supply are weighing on the housing market. Anecdotally, houses on the market are increasing but buyers are cautious.
Anything below 50 is considered contractionary.
To increase sales 32% of the builders are reported to cut prices, while 62% are giving incentives.

