
After the Fed came out as more hawkish than expected, the market sold off as the fear of an overtightening and a deep recession caused a switch to a risk-off sentiment.
The rally we saw in October and November supported by weak economic data and moderating inflation readings came to an end as the expectations of a less hawkish Fed were proved wrong. The Fed bumped up its terminal rate to 5.1% and signalled a “higher for longer” intention as the Dot Plot showed a 4.1% rate in 2024 and Fed Chair Powell pushed back against rate cuts expectations in 2023.
Of course, these are just forecasts and the Fed has been getting everything wrong for quite some time. These forecasts are shaped by incoming economic data, and we can expect them to be revised quite easily once things get really ugly in 2023 and the unemployment rate starts to pick up.
Although that may change their strategy, the risks are now skewed to an overtightening and a bad recession, which are the very worst things for the stock market.
Nasdaq Composite Technical Analysis
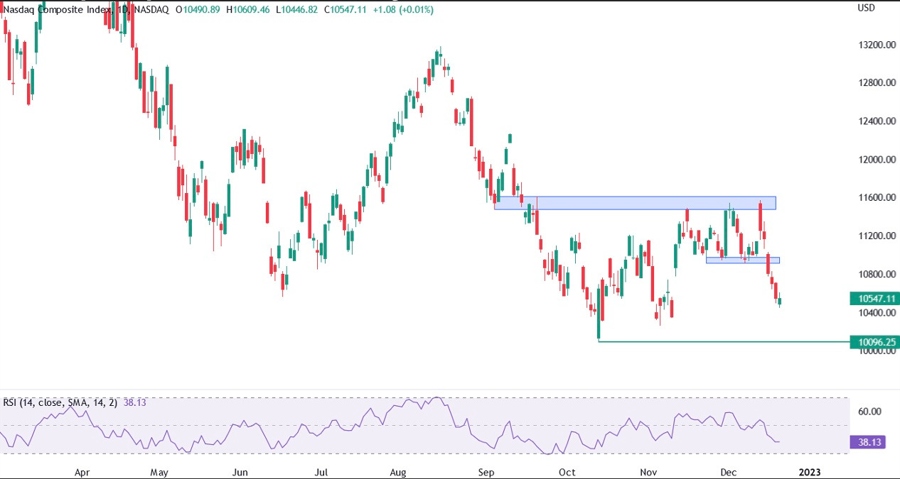
On the technical side as you can see in the daily chart above, the price couldn’t break the resistance in the 11500-11600 price area and failed for the third and last time after the miss in the CPI report. The day after we got the more hawkish than expected FOMC and that pushed the price even lower ultimately leading to the break of the support in the 10900 area and strong momentum to the downside.
All else being equal, we can expect the price to fall at least to the October low at 10096.

On the 1-hour chart above, we can see how the price has been diverging with the RSI as it tried several times to break the resistance area. Eventually, buyers gave up and the price collapsed. The break of the support in the 10900 area gave sellers even more confidence to push the price lower.

Drilling down to the 15-minutes chart above, we can see how the price has been trending downwards in a falling channel. The new development though is that the price has been diverging with the RSI signalling a loss of momentum and broke the upper band of the channel. This can lead to a short-term pullback, which generally has the top of the channel as a target.

