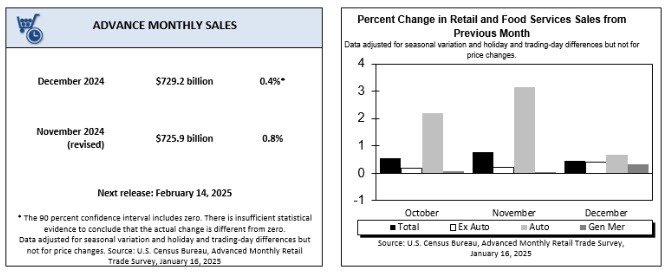
- Prior month 0.7% revised to 0.8%
- Retail sales headline 0.4% versus 0.6% estimate
- Control group 0.7% vs 0.4% estimate. Prior month 0.4%
- Core retail sales ex auto 0.4% vs 0.5% estimate. Last month 0.2%
- Ex auto and gas 0.3% vs 0.2% last month.
More details from the Census
- Total sales in December 2024 were $729.2 billion, up 0.4% (±0.5%) from the previous month and 3.9% (±0.5%) from December 2023.
- Total sales for the 12 months of 2024 increased by 3.0% (±0.5%) compared to 2023.
- Sales for the October 2024 to December 2024 period rose 3.7% (±0.5%) from the same period in 2023.
- The October 2024 to November 2024 sales change was revised from a 0.7% (±0.5%) increase to a 0.8% (±0.3%) increase.

Overall a mixed report but positive with the headline missing but the control group had a healthy rise of 0.7%
In the context of retail sales data, the control group refers to a subset of retail sales categories used to calculate GDP (Gross Domestic Product) as it excludes components that can introduce volatility or are not directly tied to consumer spending trends.
Key Characteristics of the Control Group in Retail Sales:
- Excludes certain categories: Items like autos, gasoline, and building materials are excluded because they are either highly volatile or not considered part of core retail activity.
- Focus on core consumer spending: It typically includes categories like food and beverage stores, clothing, general merchandise, and electronics.
- Purpose: Provides a more stable and reliable measure of underlying consumer demand and is closely watched as an input for economic growth analysis.
The control group is used by economists and policymakers to understand broader trends in consumer spending without the noise of volatile components.


