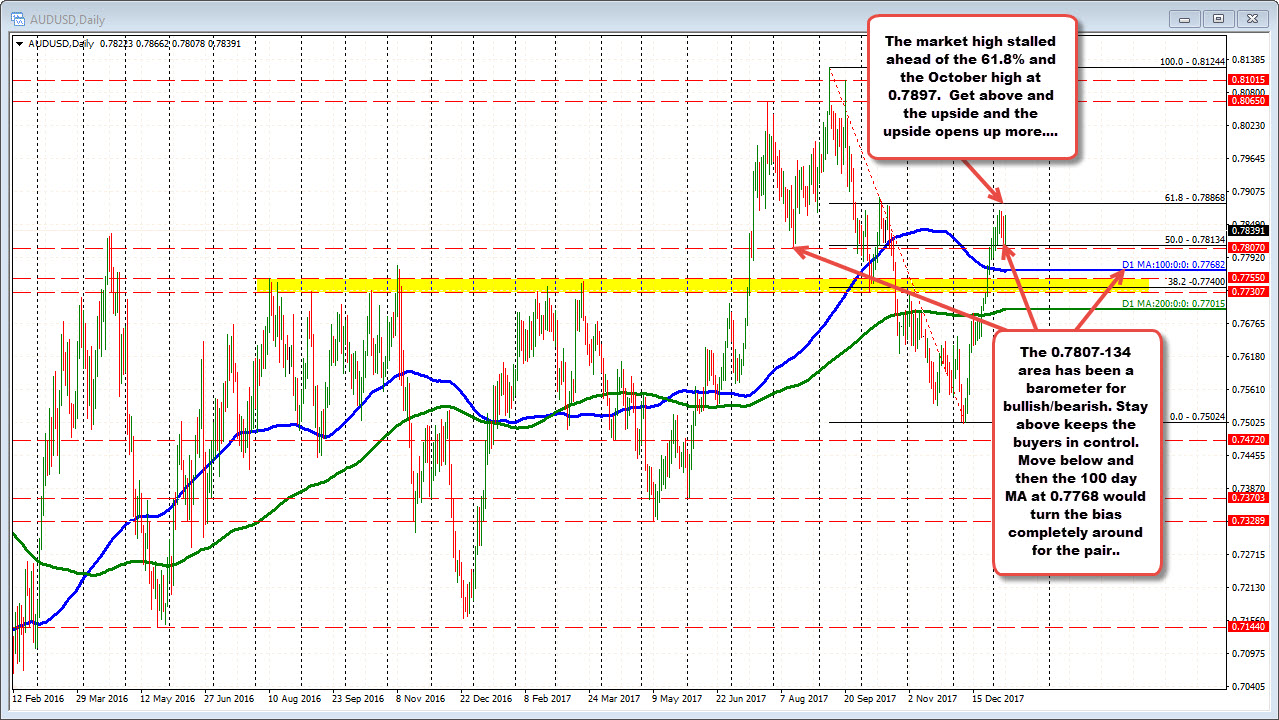
Supported at 0.7807-13
In the new trading day, Australia will release retail sales for November. The expectation is for:
- 0.4% vs 0.5% last month
- The low estimate is 0.2% and the high is 0.6%.
- A positive number would be the 3rd gain in a row (0.5% and 0.1% in October and September). That was a recovery from declines of -0.6% and -0.2% in July and August.
- In 2017, the high gain was 1.0% in April, while the low was -0.6% in August.

Technically, the price of the AUDUSD has stalled the last two trading days at 0.7807. That was a swing low from August (kinda stands out on the daily chart above). It is also near the 50% midpoint retracement of the range since the peak for 2017 in September at 0.78134.
That area - between 0.78107 and 0.78134 - is a barometer for bulls and bears. Stay above will be more bullish for the pair after the release. Move below, and the buyers above the level in the New Year, will likely throw in the towel, or at least until the price reaches another key level at the 100 day MA at 0.7768 (blue line in the chart above). A move below back below the 100 day MA and I think the attitude toward the pair turns more bearish. The 200 day MA is at 0.77015.
On the topside, the 61.8% of the move down from the September high comes in at 0.78868. Move above, opens the door for further upside momentum.
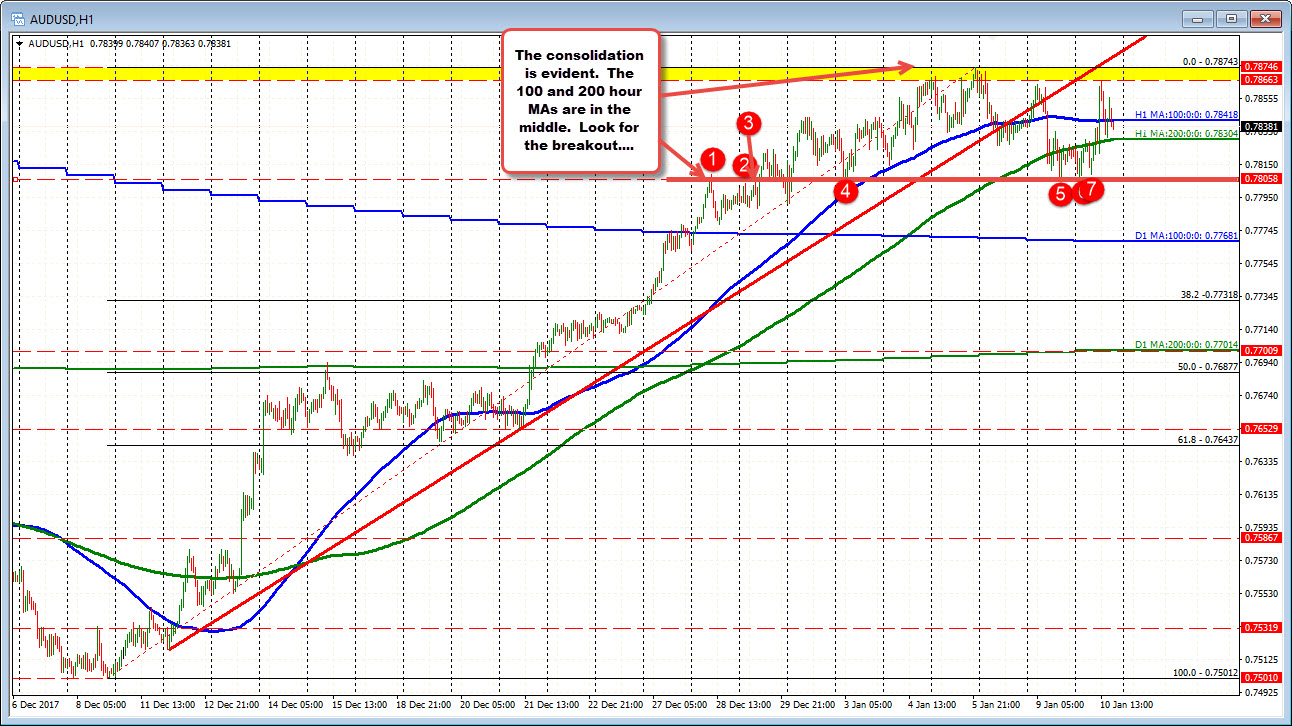
What is the hourly chart saying?
Looking at the chart below, it is showing me the consolidation of the bull run and how the market is waiting for the next push - perhaps on the news in the new day. The pair did fall below the 100 and 200 hour MAs over the last few days but the floor near the 0.7800 area is evident (see red circles). The ceiling is also evident.
The market is waiting for the next push. Look for the break out to hop on board, and look for momentum for the confirmation.


